Grafana and Pi-Hole
Even though I'm a DNS geek/enthusiast given my past, I love Pi-Hole
and use it at home on a Raspberry.
This allows me to block ads in a simple and effective manner.
(Of course it then forwards requests to a PowerDNS Recursor for several reasons).
I wanted to have a nice Grafana dashboard with info coming from Pi-Hole, so here's a quick post as I wasted quite some time because of a simple issue.
I used pihole-exporter which is a simple Go app, exporting Pi-Hole metrics to Prometheus, which can then be grabbed by Grafana.
Installing it is a no-brainer and works well - I just downloaded the arm binary (because RPi),
then launched it with:
./pihole_exporter -pihole_hostname <my_pihole_ip_address> -pihole_password <my_pihole_password>
I could then confirmed it worked well by checking the URL http://
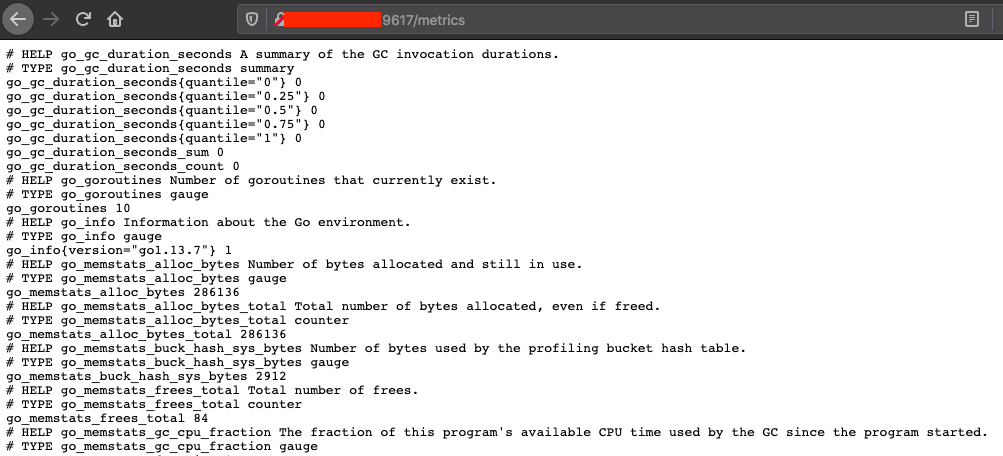
I then updated my Prometheus configuration to include this new endpoint:
    scrape_configs:
      - job_name: 'pi-hole'
        static_configs:
          - targets: ['X.X.X.X:9617']
and confirmed Prometheus could see it as a target:
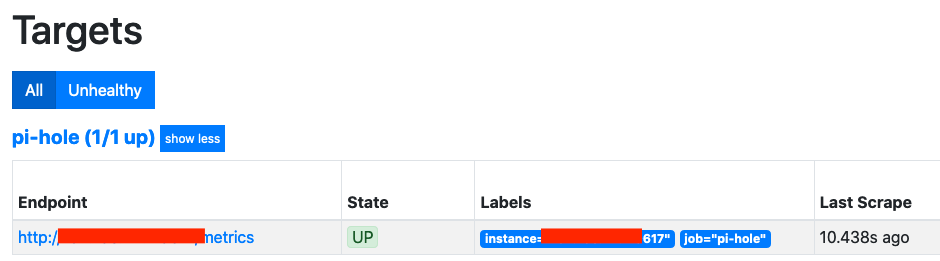
But then when importing the Grafana Dashboard given as reference on the Github page, I got this in Grafana:
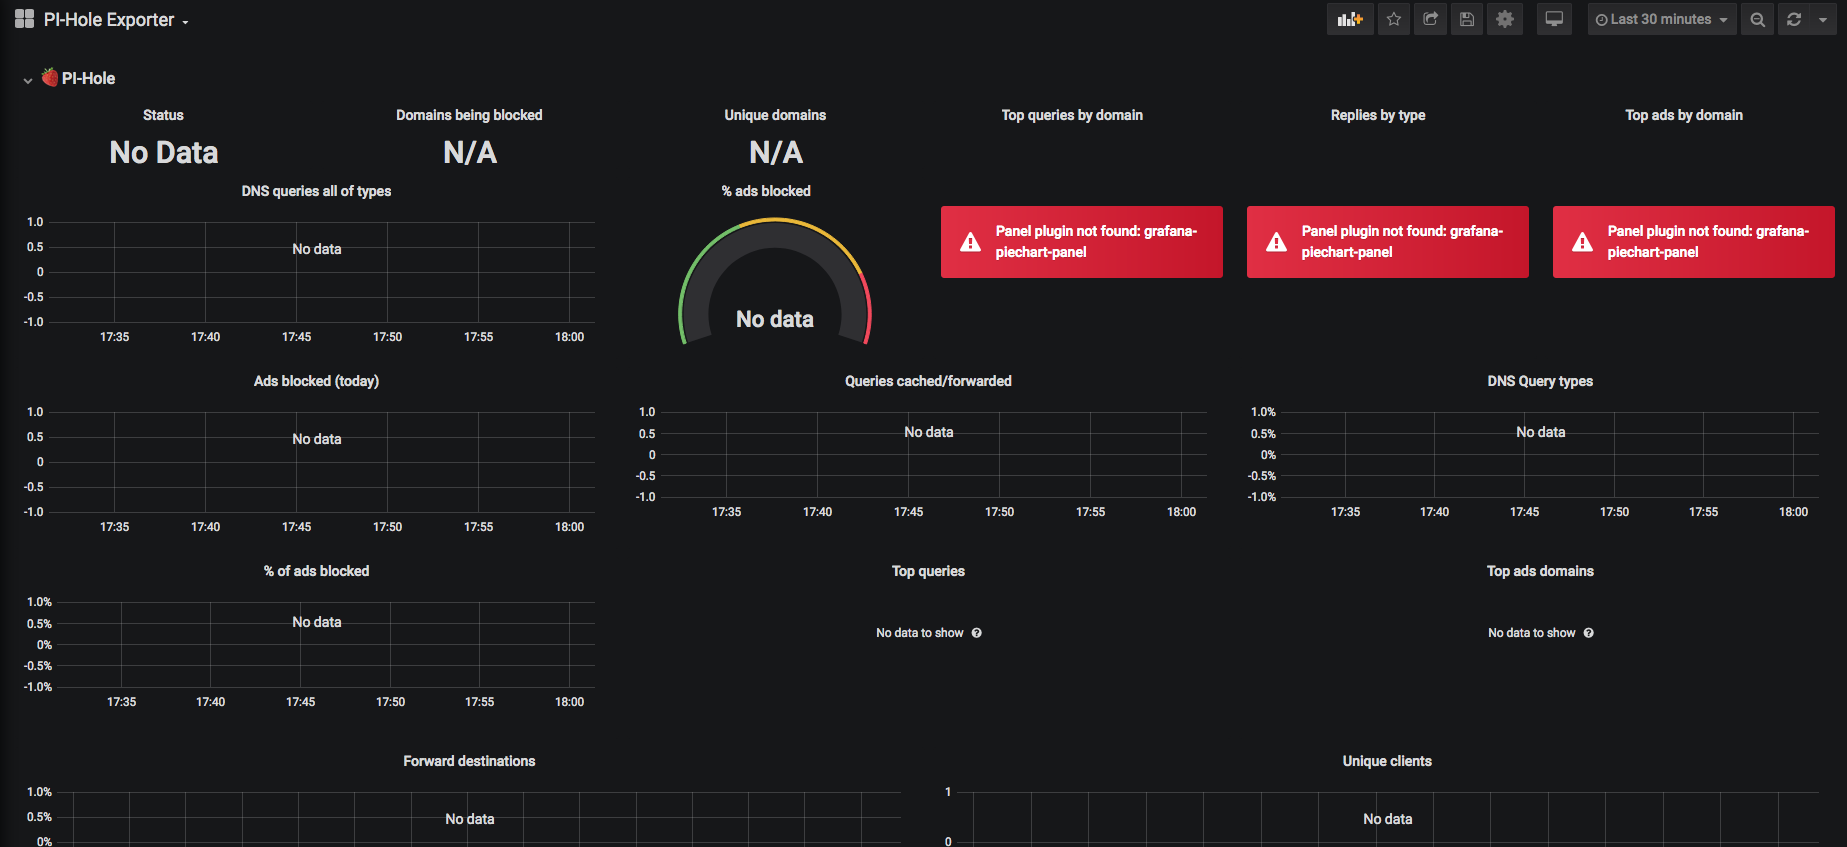
Downloading the JSON and importing it in Grafana gave the same result.
I tried changing a few things, e.g. changing some panels configuration,
and noticed that the source was InfluxDB (which is my default source), and not Prometheus.
Which explained why it didn't work.
Changing the source to Prometheus in one of the panel worked, but I had to change also
the query as it didn't keep it from the JSON file.
So definitely not something I wanted to do.
I then checked the project's issues, just in case... and found this one
which was exactly the problem I was hitting.
Looking at the answers, I couldn't fix it, as my Prometheus was correctly configured.
And then I noticed someone stating "Probably the same issue: #28".
When checking this other issue, boom!
It turns out that the Grafana dashboard expects Prometheus to be the default source, which was not the case for me.
So to fix this:
- Change Grafana's default source from InfluxDB to Prometheus,
- Edit every panel of the Pi-Hole Dashboard, and change the Datasource from "Default" to "Prometheus",
- Otherwise when you switch back the default source to InfluxDB, this would break again the Pi-Hole Dashboard
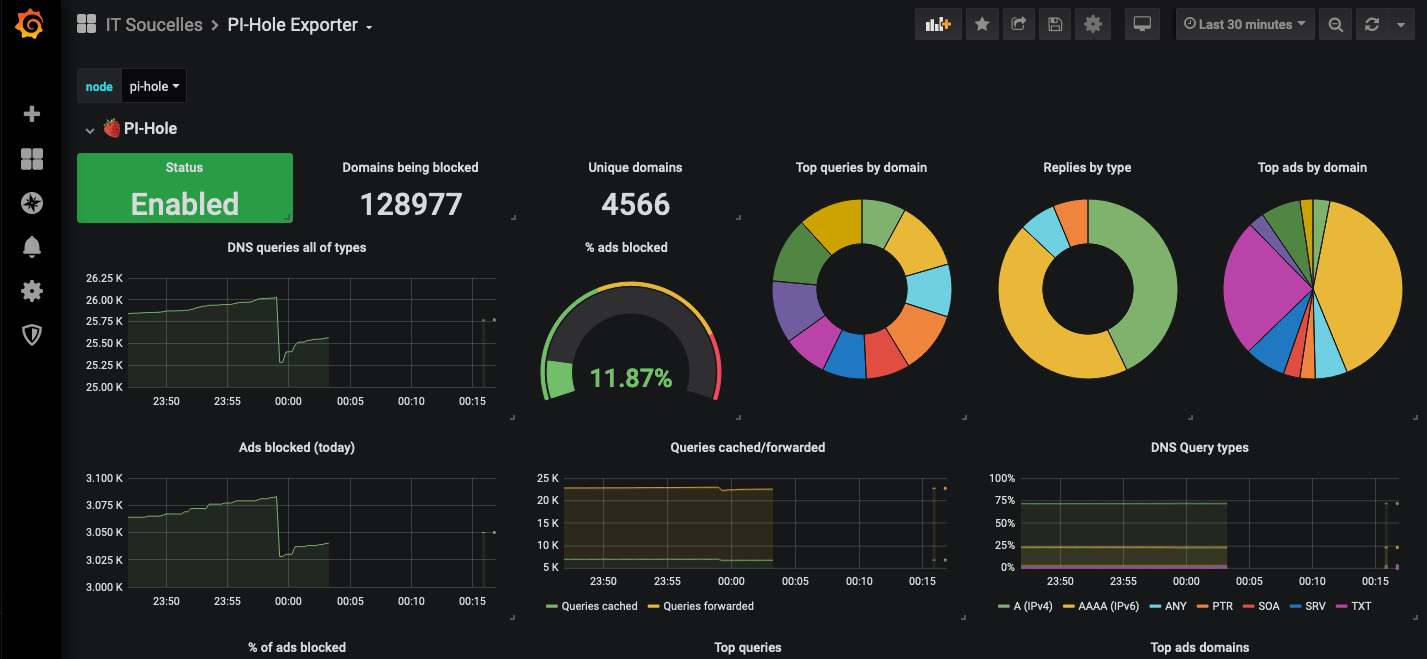
- Then switch back the default source to InfluxDB.
- Enjoy:
Bonus
If you want to have the exporter to be started at boot, just follow the steps described here.
Tags: IT, Opensource