A deep dive on SmashRun for detailed running statistics
If you're a runner, chance is that you want to analyse your runs with fancy diagrams. You're in luck, as SmashRun aims exactly at that!
SmashRun?
There are tons of websites/applications available when you're running.
The most popular ones are Strava, RunKeeper, Map My Run (yes, I know I have
probably forgotten a lot of them!)
SmashRun is a bit different compared with the above list: it's mainly available via their website - although there's "LongRun", an iOS app (developed by a 3rd party developer) - and focuses on providing you with detailed metrics about your runs.
SmashRun, as the name suggests, only deals with runs: no cycling, swimming nor any other sport - just running.
I discovered SmashRun thanks to my buddy Eole in
2018 and initially I used it only from time to time, when I wanted some more
details - back then, I had a Strava subscription, which was providing me with
enough information.
But as I became more serious about running, increasing my weekly mileage and
introducing diversity in my training, I needed a lot more and wanted to "dive"
into my statistics.
At the same time, I had some "philosophical" issues with Strava (e.g. the problem that they had with Relive), and the fact that I described it as "Facebook for runners" summed it up pretty well for me. So while I didn't (yet) leave Strava (as I did for Facebook a while ago), I stopped paying for the subscription, and only upload my runs and check out my friends' sessions, nothing more.
So focusing my analysis on SmashRun made even more sense - which is why I decided to subscribe to their "Pro" version, which brings a lot more features.
SmashRun, High-level overview
SmashRun describes themselves as "Understand your running, by visualizing your data".
And that's a pretty good summary: while you have some "social" features, allowing to add friends and see how you compare with them, that's not really SmashRun main goal - where it shines is at drilling down into a specific workout, or check how you did compared with another session.
How to use it?
SmashRun does not record your runs (like Strava or others would do).
Insteed, you need to import one of your runs to get started.
This can be done in different ways:
- import a file (currently supported formats are GPX, TCX, FIT and ZIP),
- use SmashRun integration with most popular devices/services:
- Garmin
- Suunto
- Polar
- Strava
- Fitbit
- MapMyRun
- Runtastic
- TomTom
- you can also have your mobile app to send your GPX file by email to
<yourusername>@smashrunimport.com, and SmashRun will magically import if for you!
How do I sync my runs to SmashRun?
Personally, I'm using the excellent RunGap on iOS to
upload my runs to SmashRun - that's one of the very last reasons why I'm still
using iOS for "personal reasons", as my personal phone runs SailfishOS and
there's not yet a way to get my runs out of my Suunto watch, and upload them to
SmashRun.
This, and the fact that it's my work iPhone, so I use it for work ;)
Looking at a Run
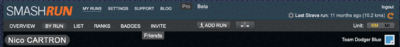
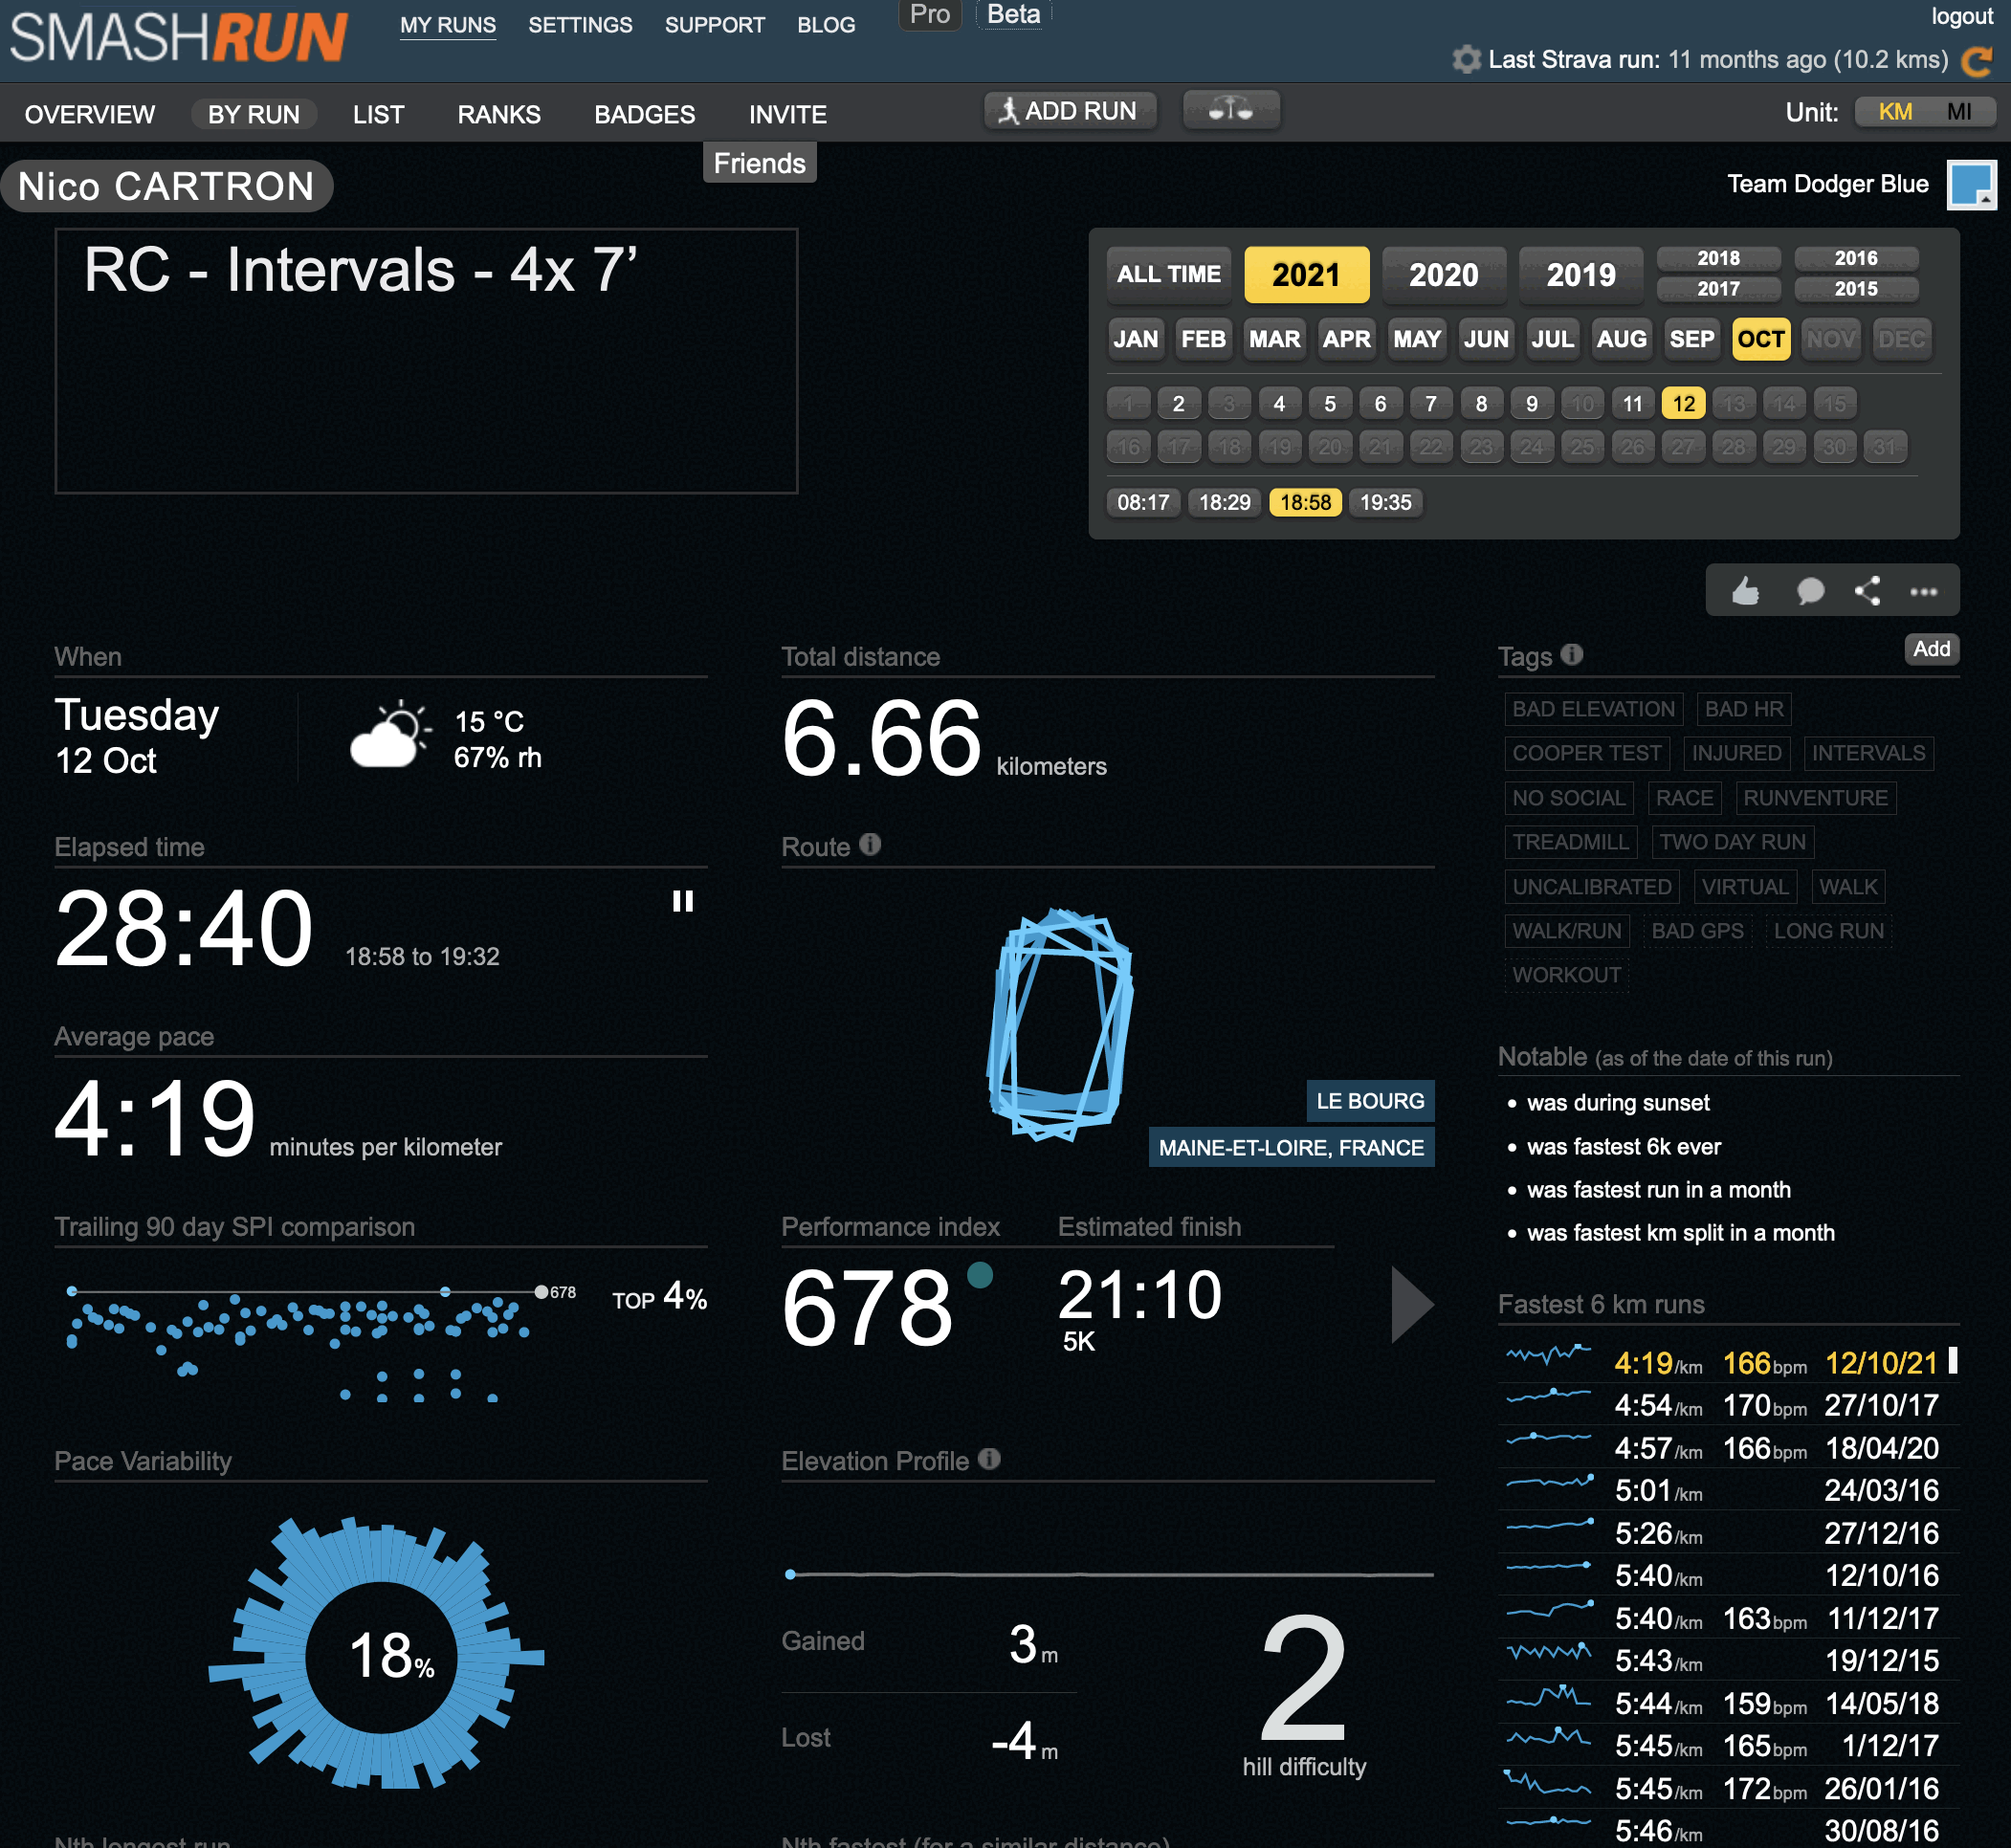
Once your run is imported, you can litterly deep dive into it, thanks to SmashRun very detailed statistics.
Here's a recent run I did:
That's a lot of information, so let's look at that one by one:
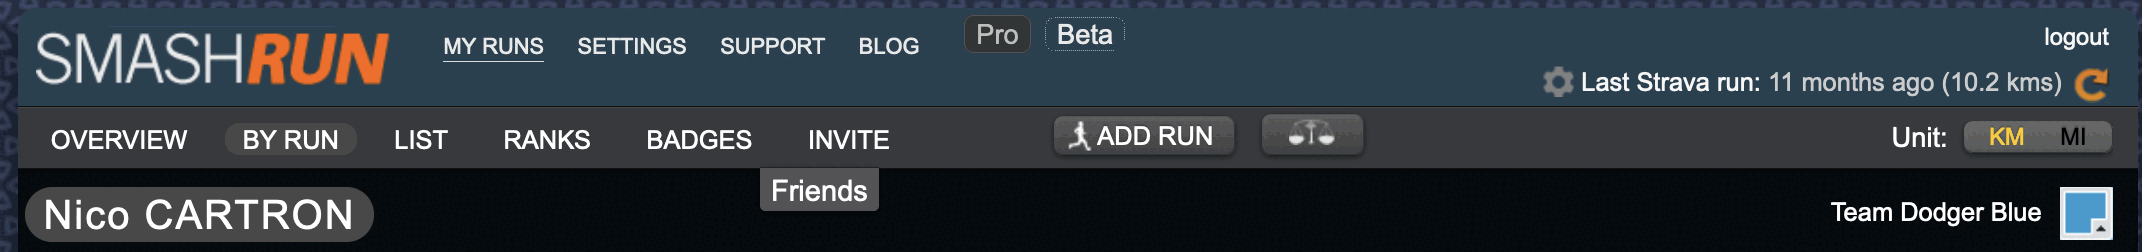
Top menu:
The top menu is common across all pages, and is composed of two rows:
the first row gives you access to "My runs" (see below), as well as settings, support and blog.The second row ("My runs") menus include:
- Overview: displays your runs statistics ("all time" by default)
- By Run: details about your latest run - possibility to select another day/month/year
- List: lists all your runs
- Ranks: how do you rank against your friends and comparable runners (age)
- Badges: displays all the badges you earned, and the ones you're missing
- Invite: invite a friend and get some free months of SmashRun Pro
- Add Run: upload a file (GPX...) in cae you're missing a run
- Weight (icon): update your weight to adjust calories calculation
We'll look at some of those items more in details in the "Deep Dive" section below.
Date-related statistics
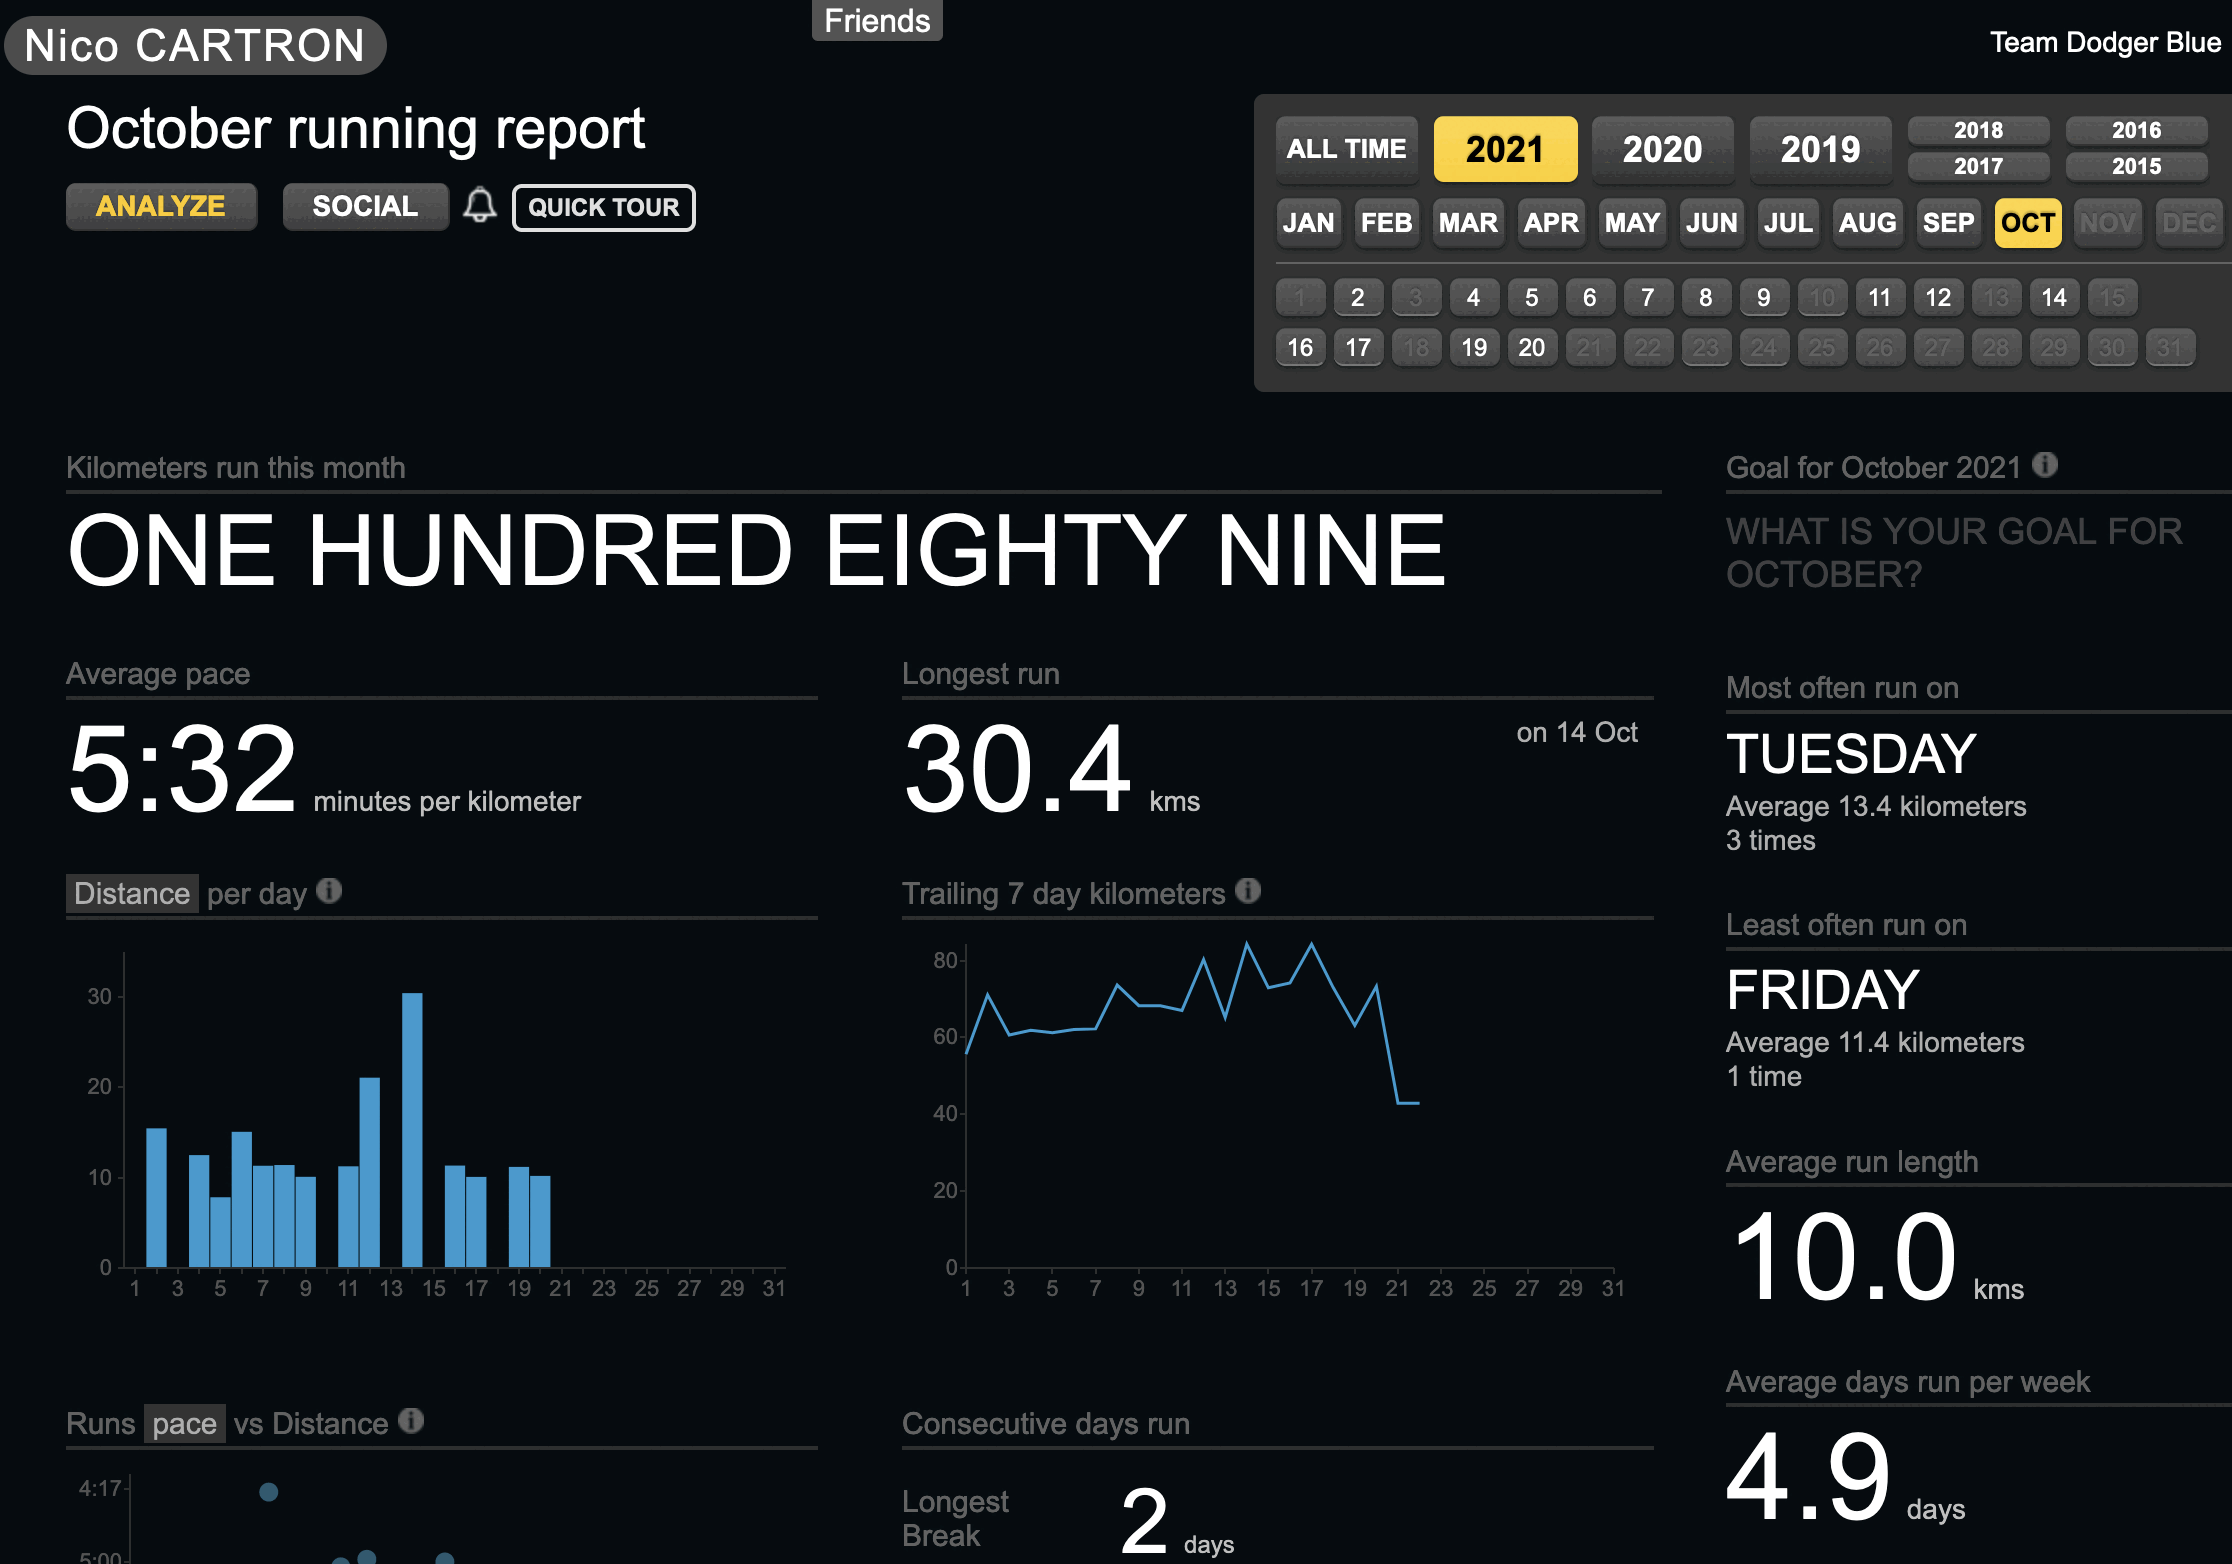
Below the top menu, you'll find statistics which will depend on the date you have selected in the top right "calendar".
Below, you can see I have selected a specific run (Oct 12, 2021 - 18h58):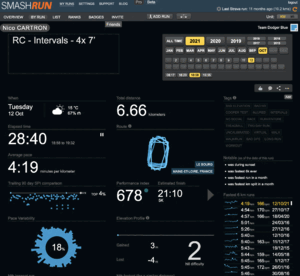
But if I switch to say October, then the display changes:

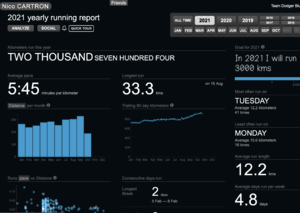
And the same is true if I select 2021:

Free vs. Pro
SmashRun is free and you get access to quite a lot of features.
But as with any product, it is developed by real human beings who have bills and
mortgages to pay like anyone, not to mention the hosting costs.
So what do you get when opting in for "Pro"?
- access to the "Detailed Map" (see below)
- access to the 4 "Analyze" / deep-dive features (see below)
- access to a lot more statistics
- a bit more badges (OK, not the most interesting difference, but hey)
All details are available here.
SmashRun Pro costs 45€ per year, and to be honest this is really worth it.
SmashRun team is really small: they're just 3 people (Jacklyn, Chris, and Steve) and really doing a nice job.
Deep Dive
OK, so let's have a closer look at one of my runs.
I have annoted "a bit" the statistics screen, so that it's clear what each section does. I have broken down the sections in 3 categories:
- Distance related sections (in red)
- Speed related sections (in green)
- Others (in orange)
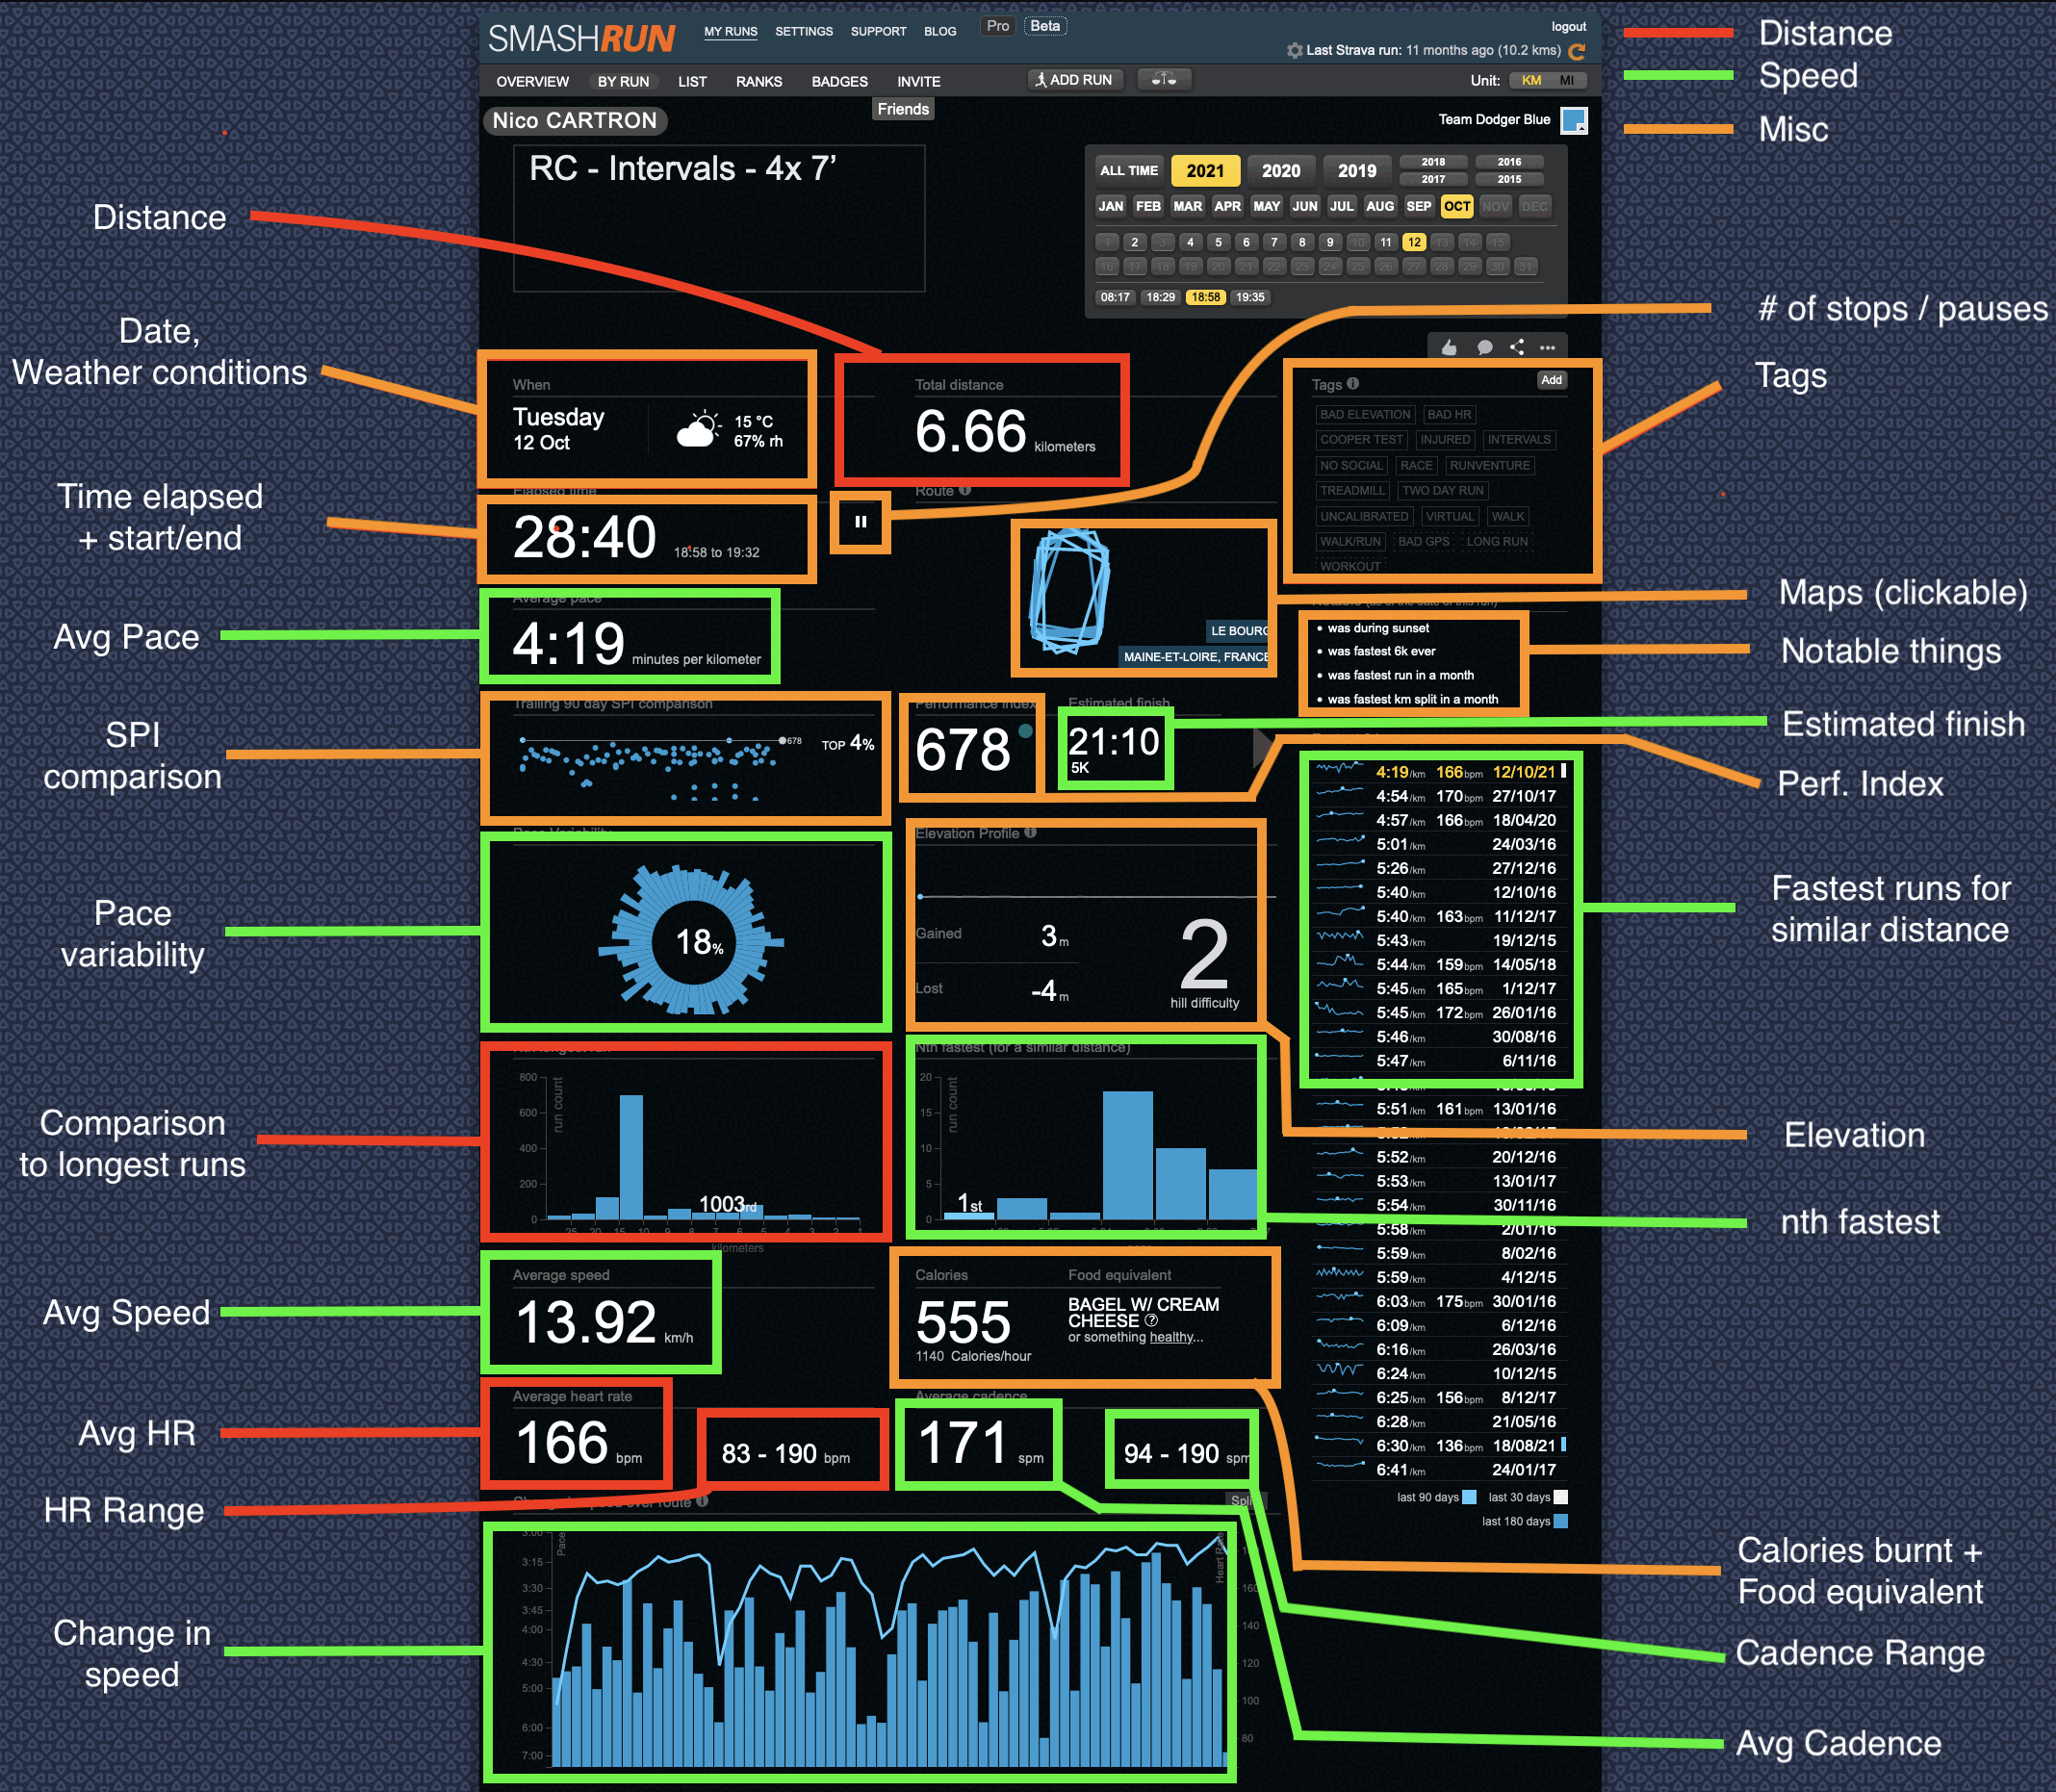
That's a lot of details, so let's have a look by category:
Details per category
Distance category (red):
- Distance: total distance for the run (6.66 Kms in my case)
- Comparison to longest runs: in my case, that was my 1003rd longest run - obviously far from a long run ;)
- Average Heart Rate: pretty obvious
- Heart Rate range: useful to see how hard you pushed
- (yes, I know that HR is not distance related, but I realised those were in red once I had finished putting all the legends ;)
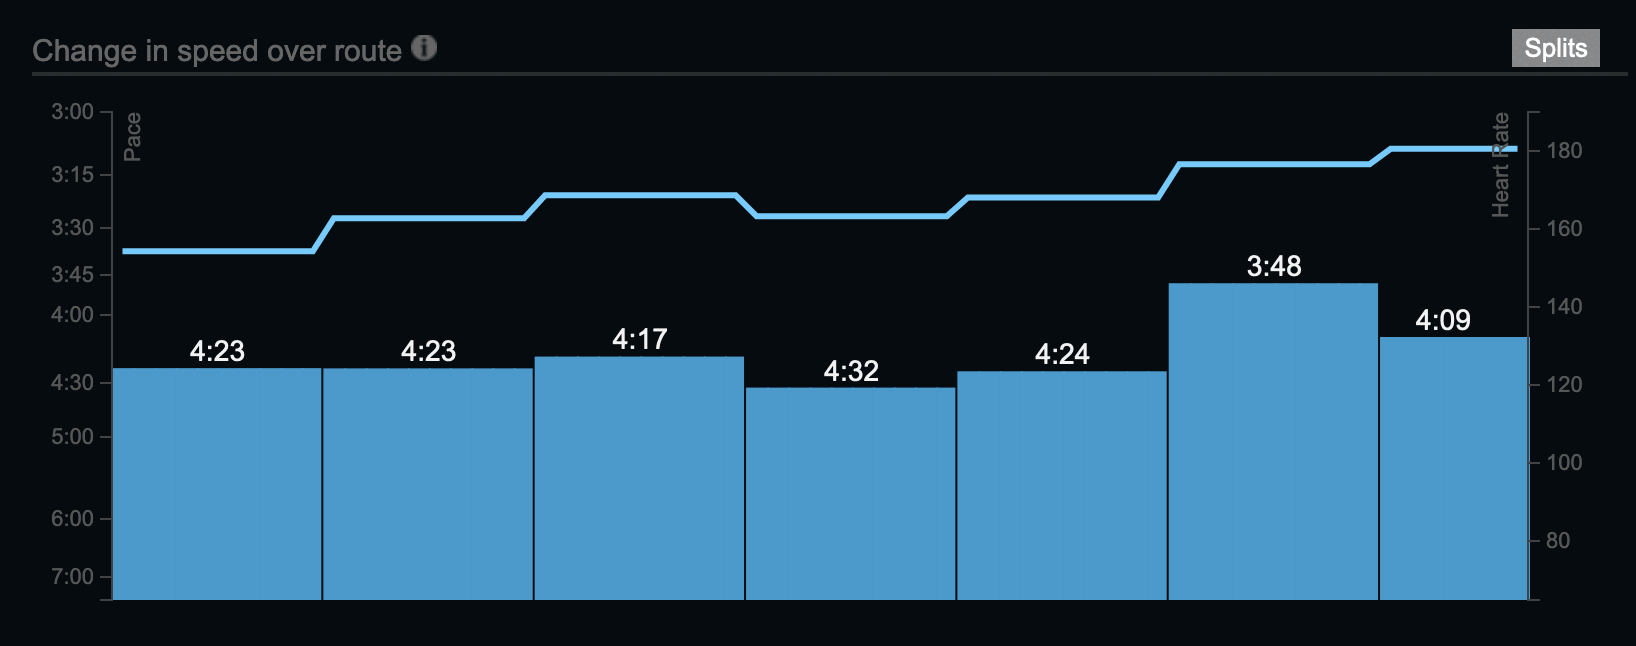
Speed category (green):
- Average Pace: pretty obvious
- Estimated finish: calculated time, based on this run's pace, to finish 5K, up to Marathon
- Pace Variability: shows the variation of your pace for this run - should be stable if you ran a "normal" run, and a lot less stable if e.g. you did intervals training
- Fastest runs for similar distance: to see how this run ranks against others of your runs
- nth fastest: how fast was this run? in my case, that was my fastest 6k ever
- same info as the previous section, but presented with graphs
- Average Speed: pretty obvious
- Change in speed: speed variation
- can be displayed per 100m, or per split (1K)
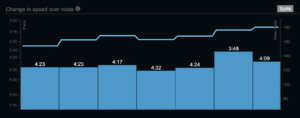
- it's also possible to select a specific distance (e.g. 300m) and slide
right/left to get even more details
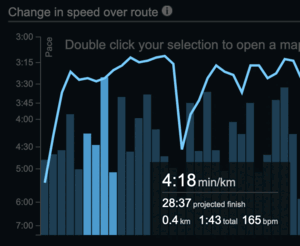
- can be displayed per 100m, or per split (1K)
- Average Cadence
- Cadence Range
Misc/Other category (orange):
- Date & Weather conditions: useful to remind you about the weather you had during a specific run
- Time elapsed + start/end: how much time you ran, along with time start and end - useful e.g. when you paused your watch
- Number of stops/pauses: a mouse over will show details, and you can remove those stops if you want (e.g. if that was a race) to get the real time elapsed displayed
- Tags: a way to "qualify" your run
- you can use predefined tags,
- or add your owns
- Map : displays a detailed map with more statistics, upon clicking on it (see below)
- Notable: interesting notable things, such as:
- coldest/hottest run in X months,
- during sunrise/sunset,
- longest run
- ...
- Elevation:
- Gained / Lost
- Also shows "hill difficulty"
- Calories burnt:
- Based on your height/weight
- Also shows the equivalent in food (healthy/non healthy) - very fun and informative!

Detailed Map (Pro feature)
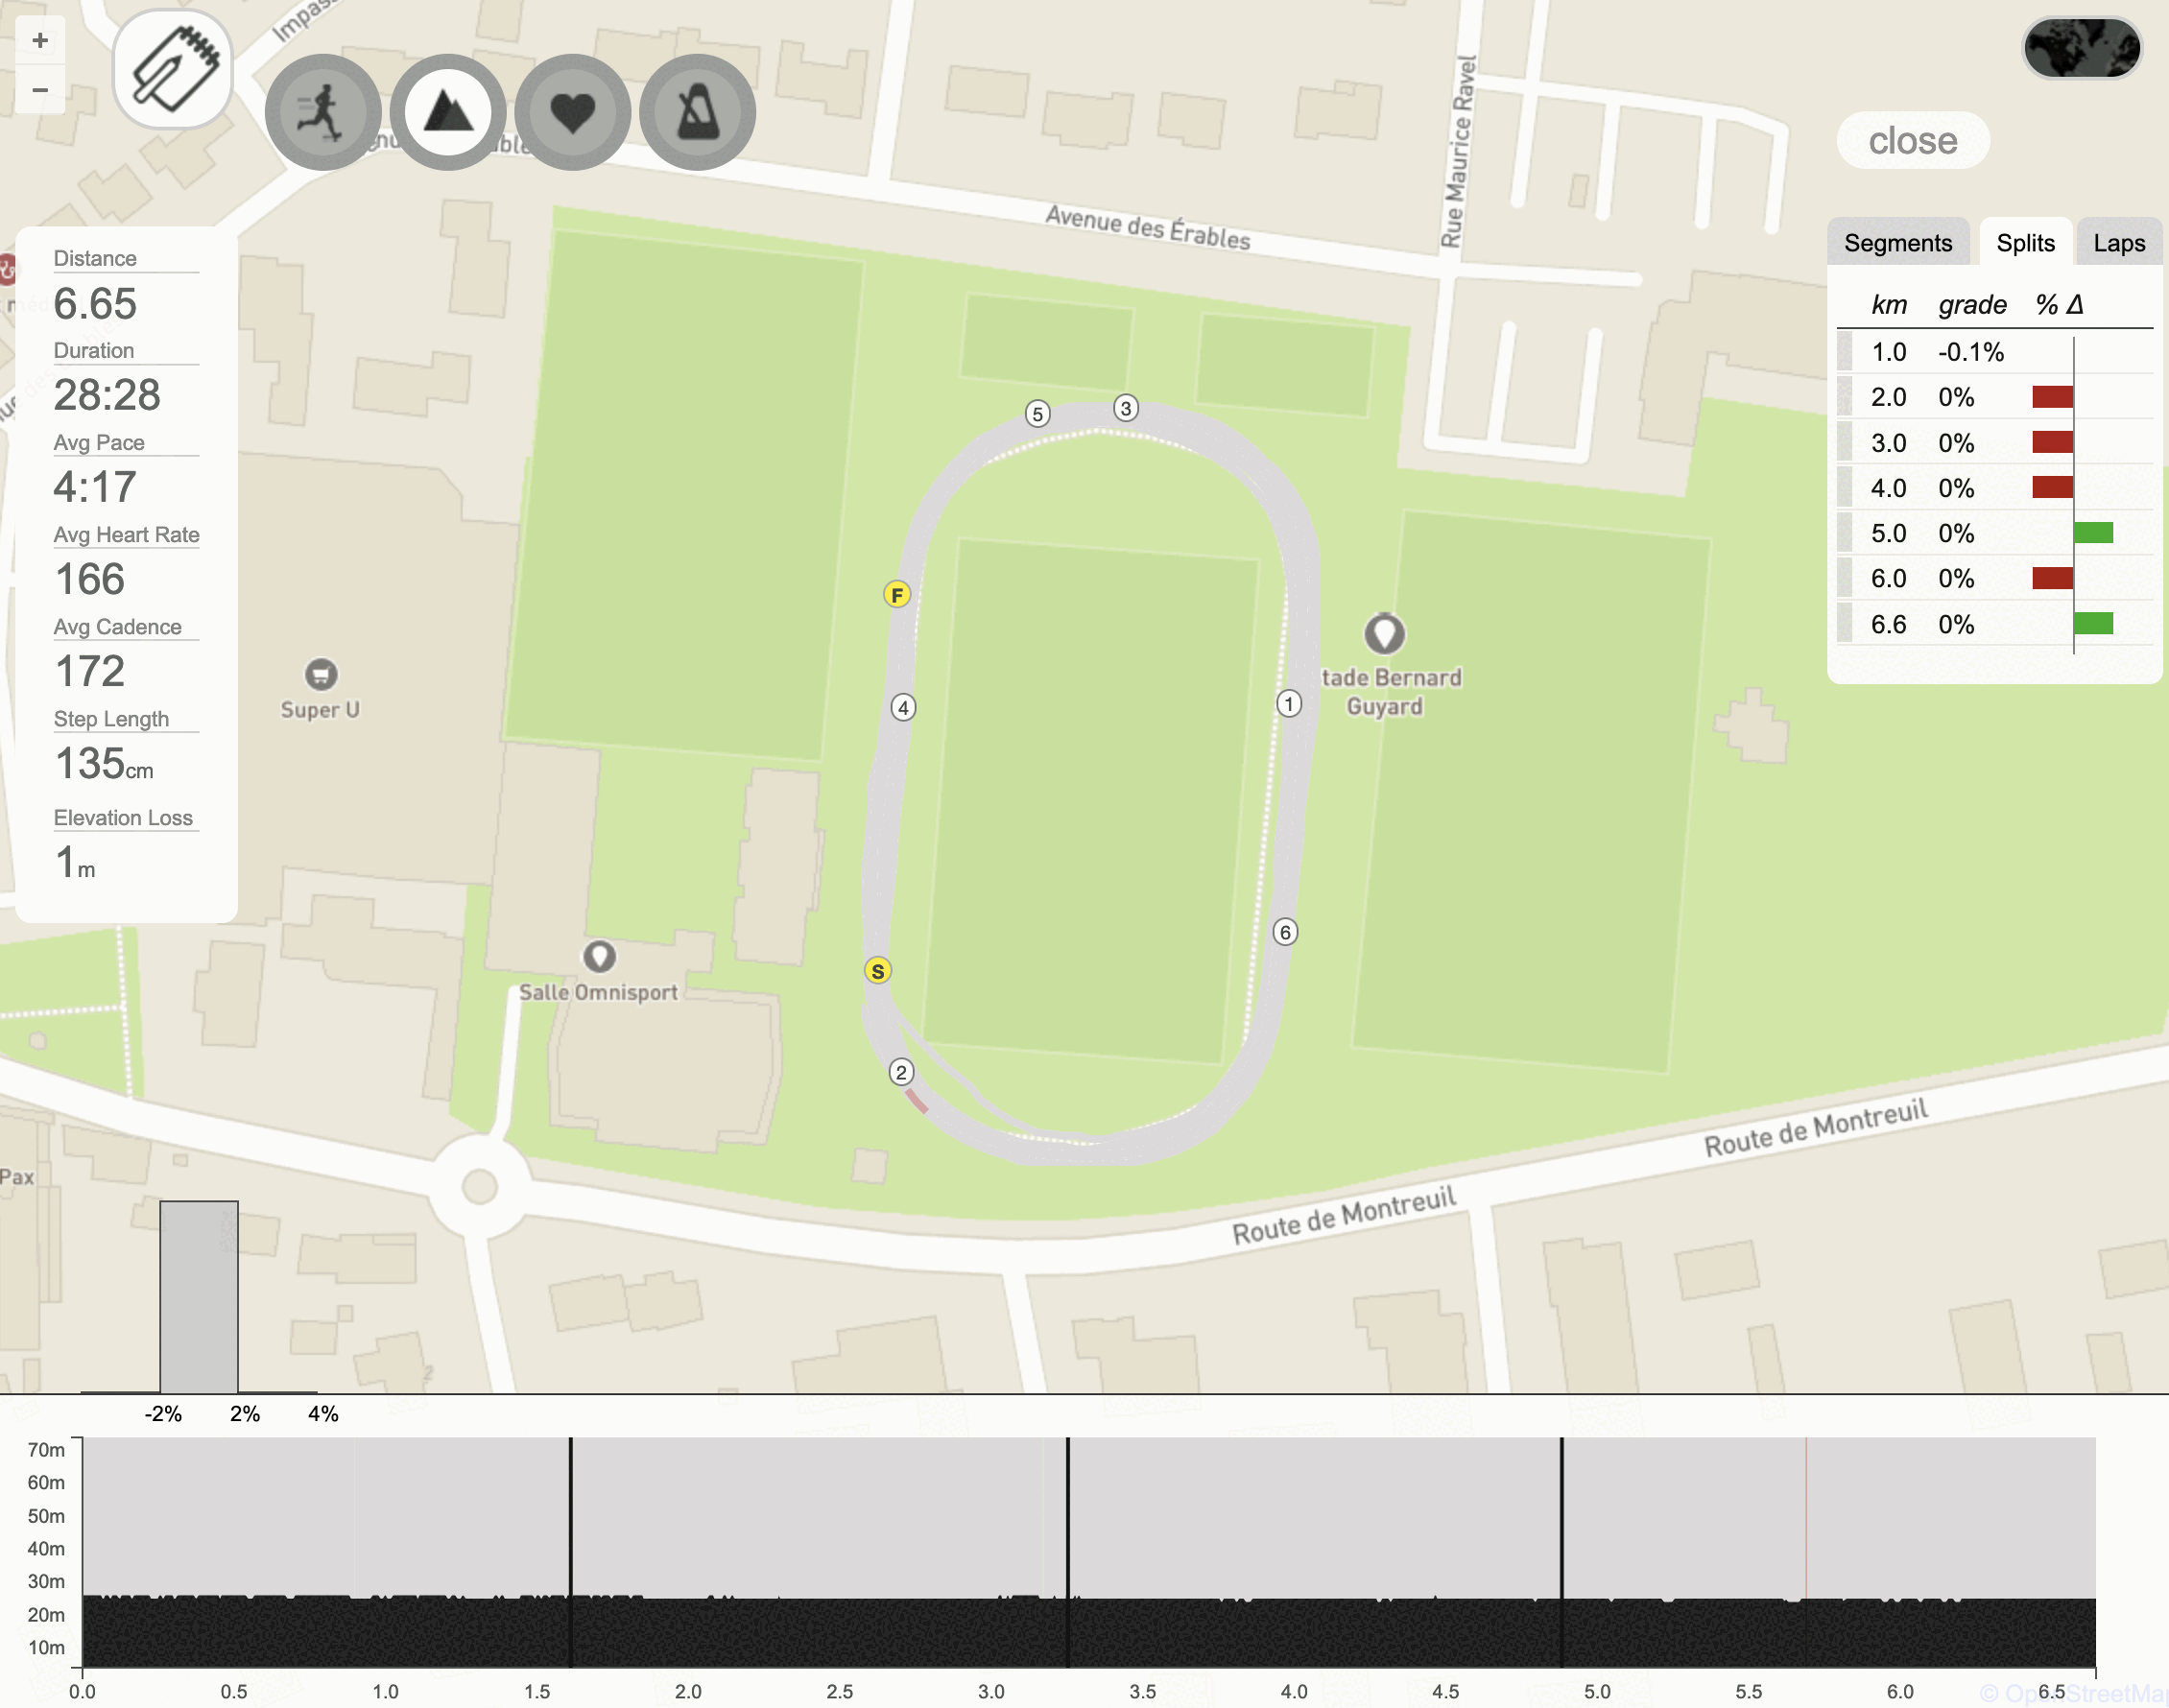
When clicking on the map in the "Run" screen, you'll be presented with a detailed map, with a lot more statistics:
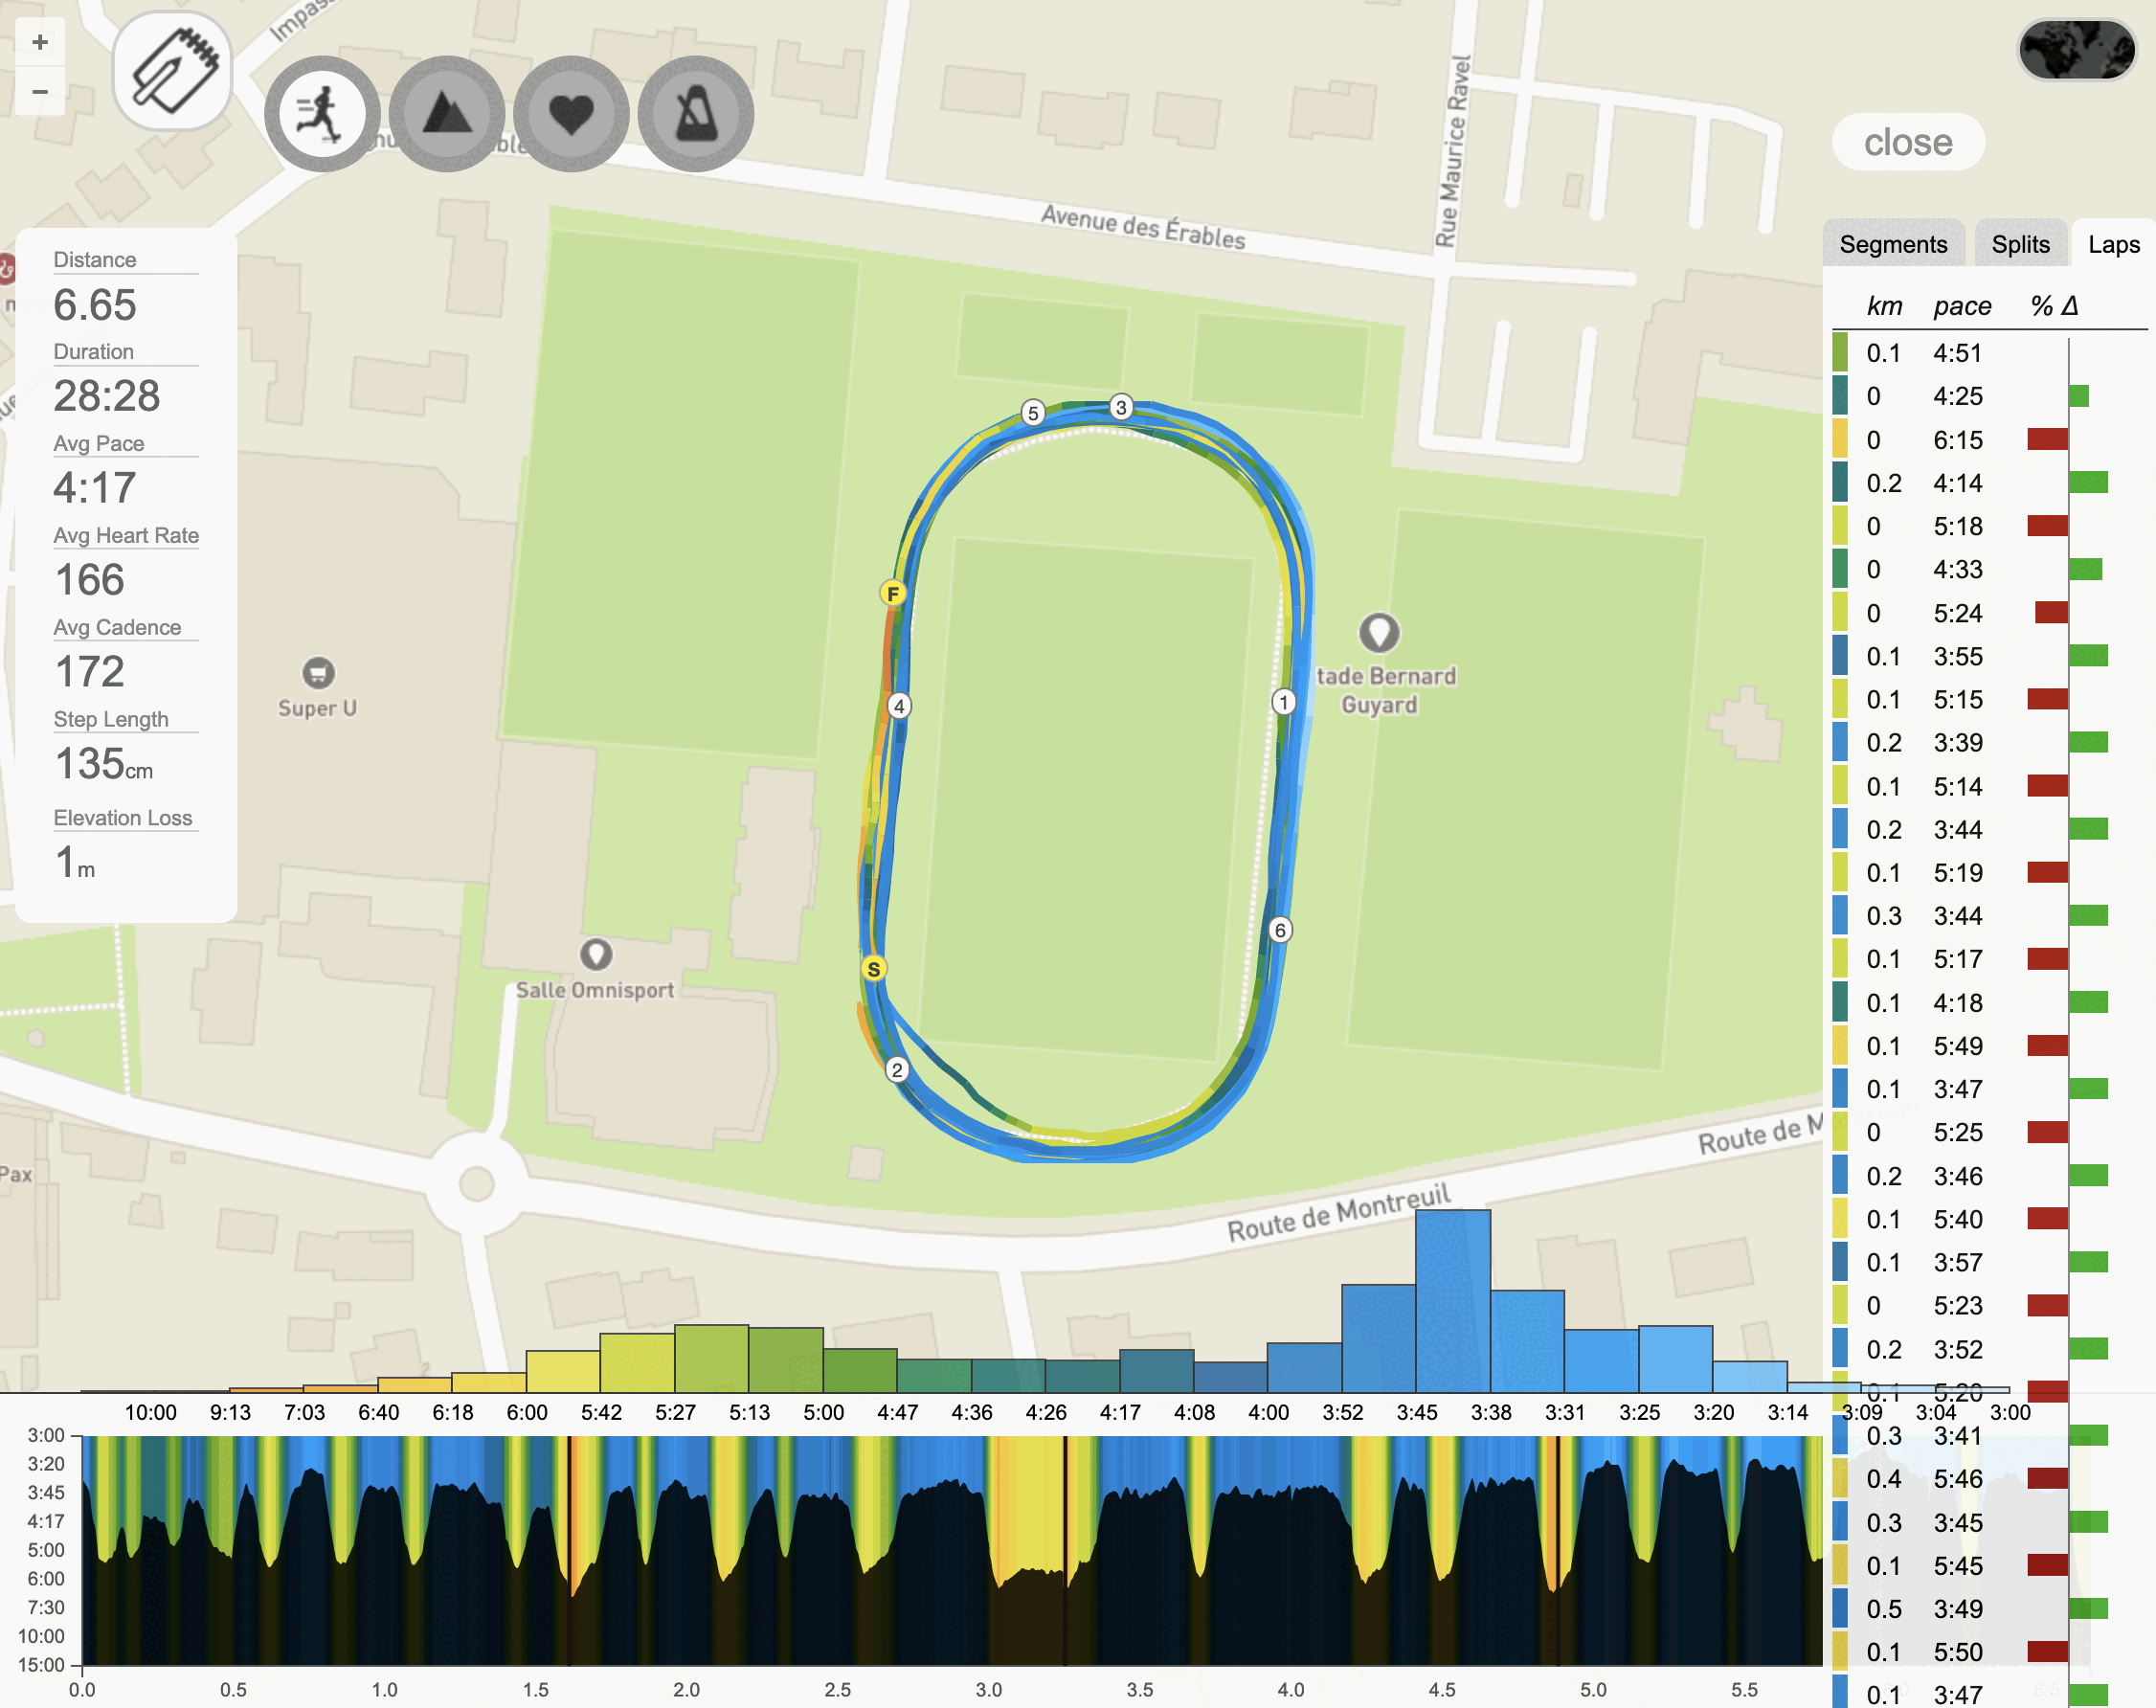
You can see:
- basic statistics (distance, duration, ...) on the left hand side,
- a colored map showing (by default) your speed,
- segments/splits/laps on the right hand side,
- a distribution of your speed at the bottom
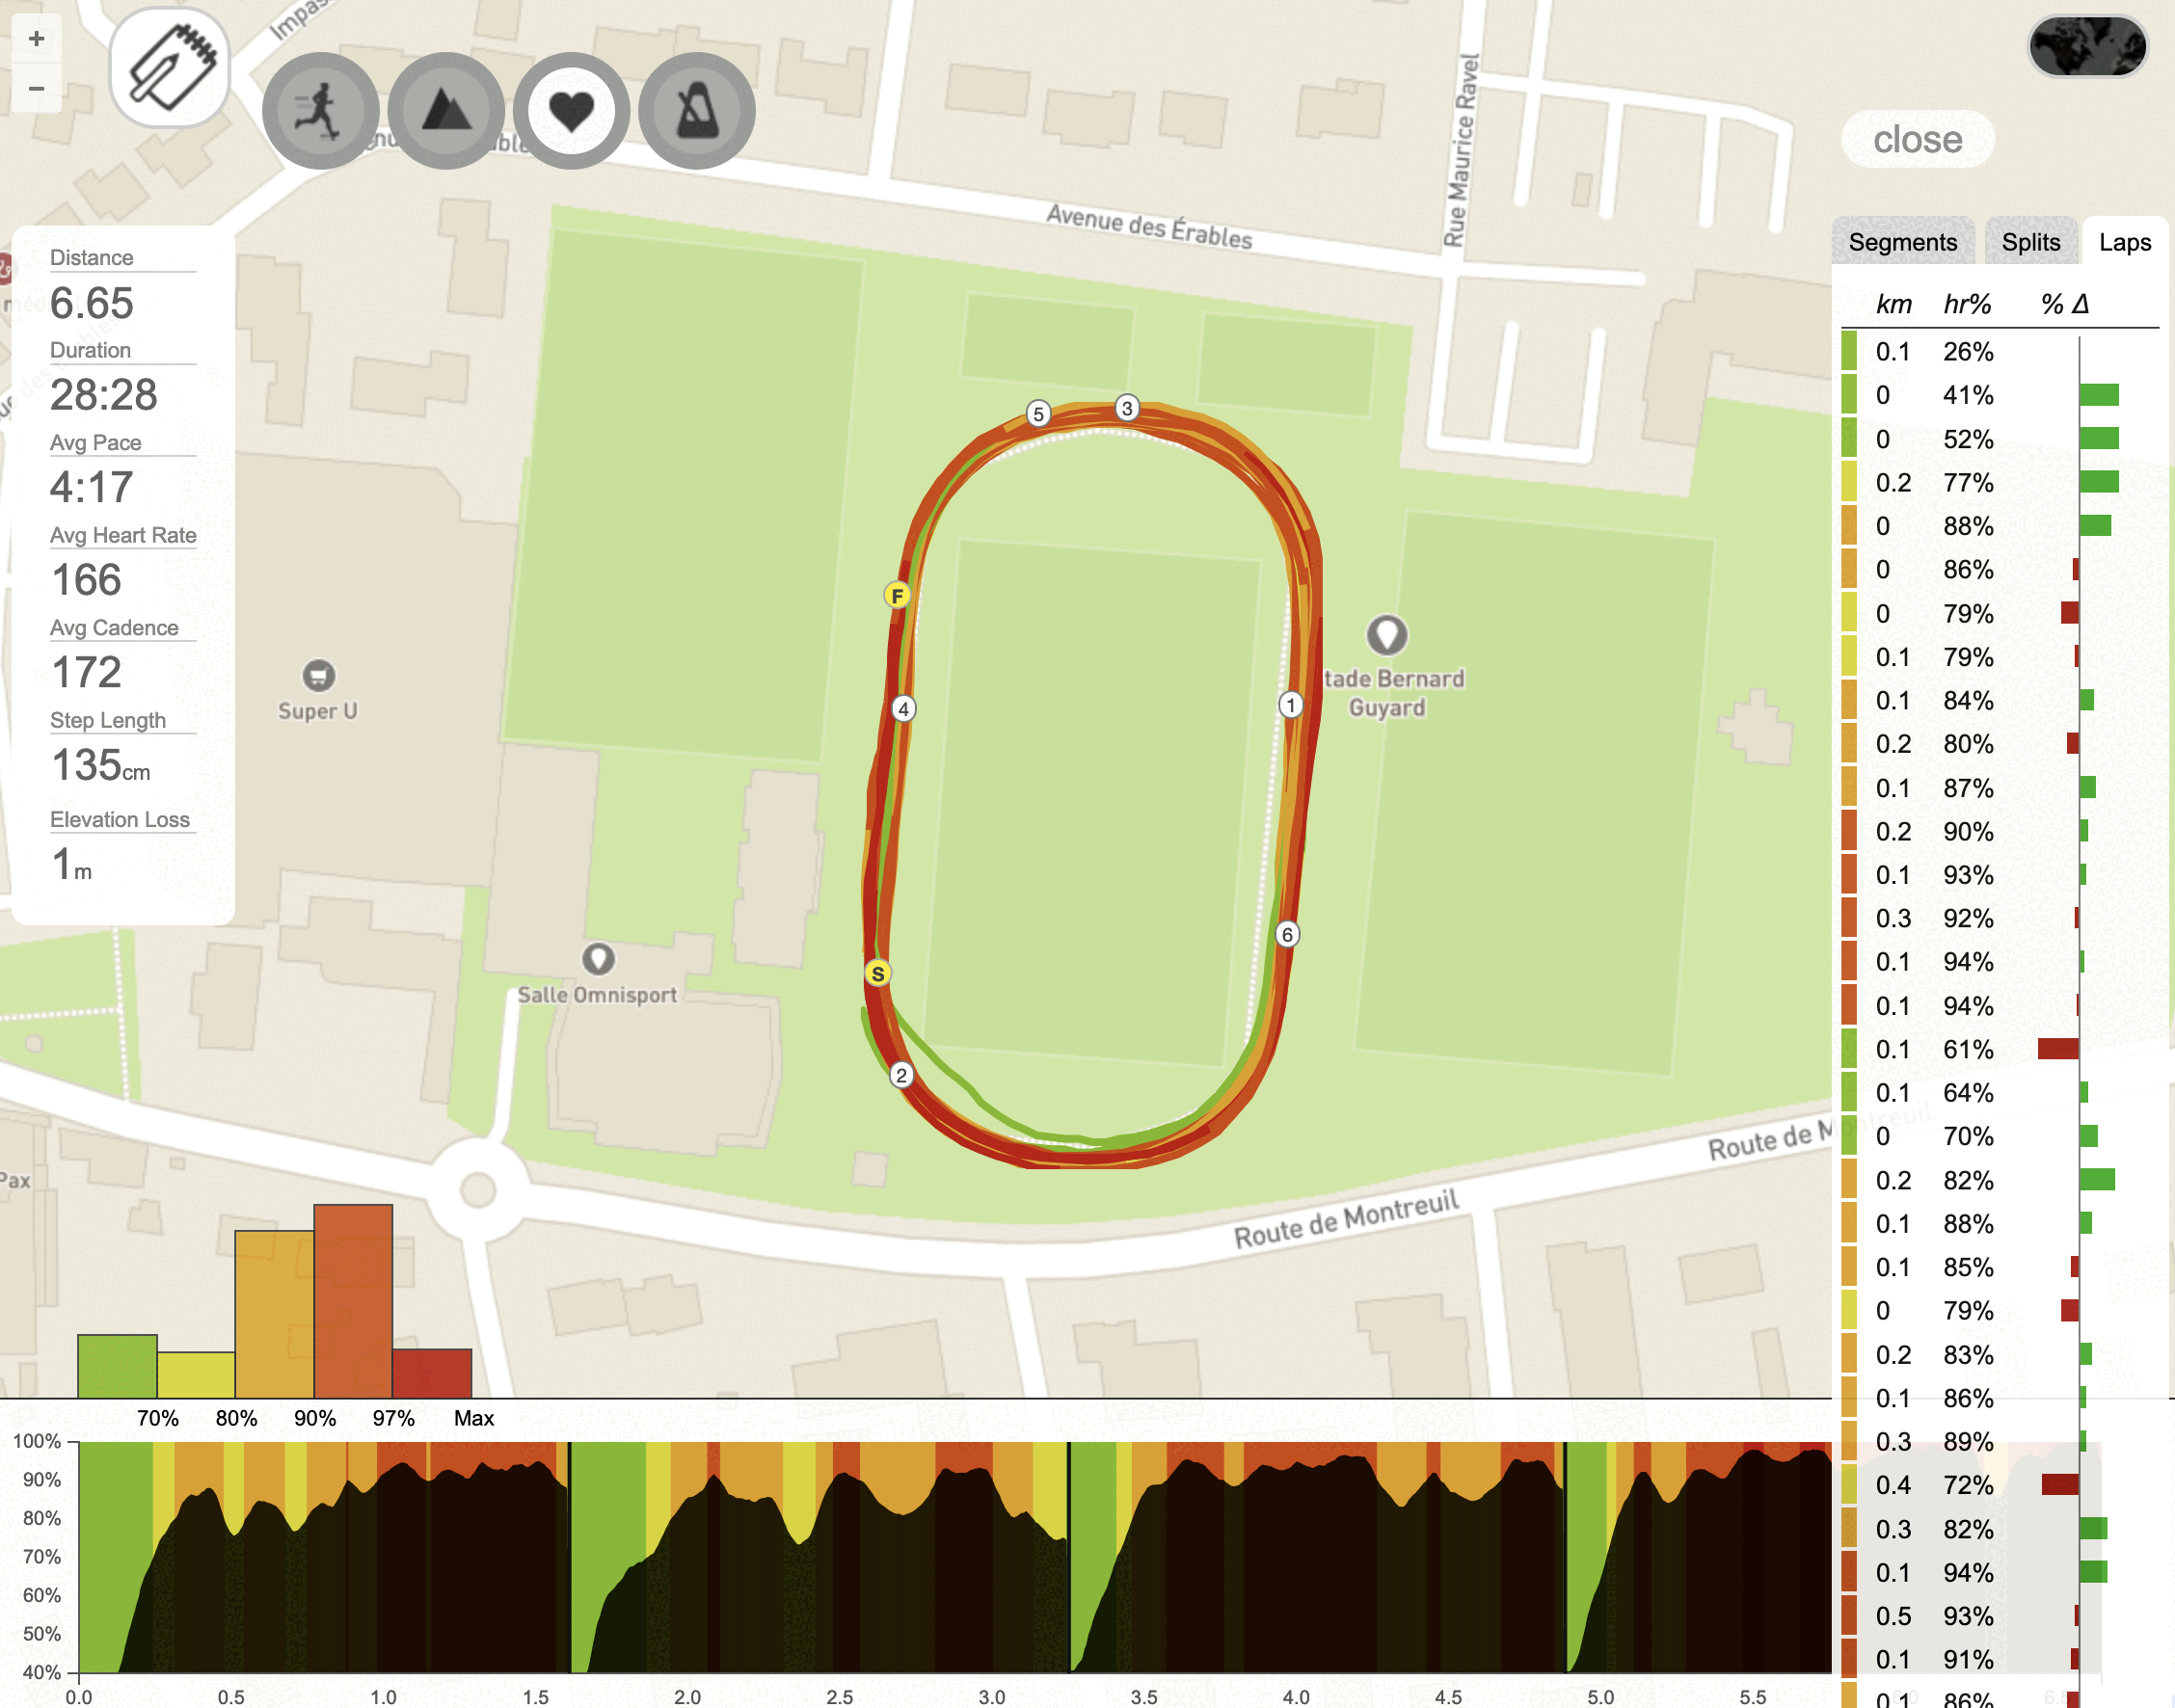
You can change the kind of information displayed, by clicking on one of the 4 icons at the top, and switch between Speed, Elevation, Heart Rate and Cadence.
Here is the same map, displaying statistics about Elevation:
(pretty flat as I ran on a track!!)
and the same with respectively Heart Rate and Cadence:
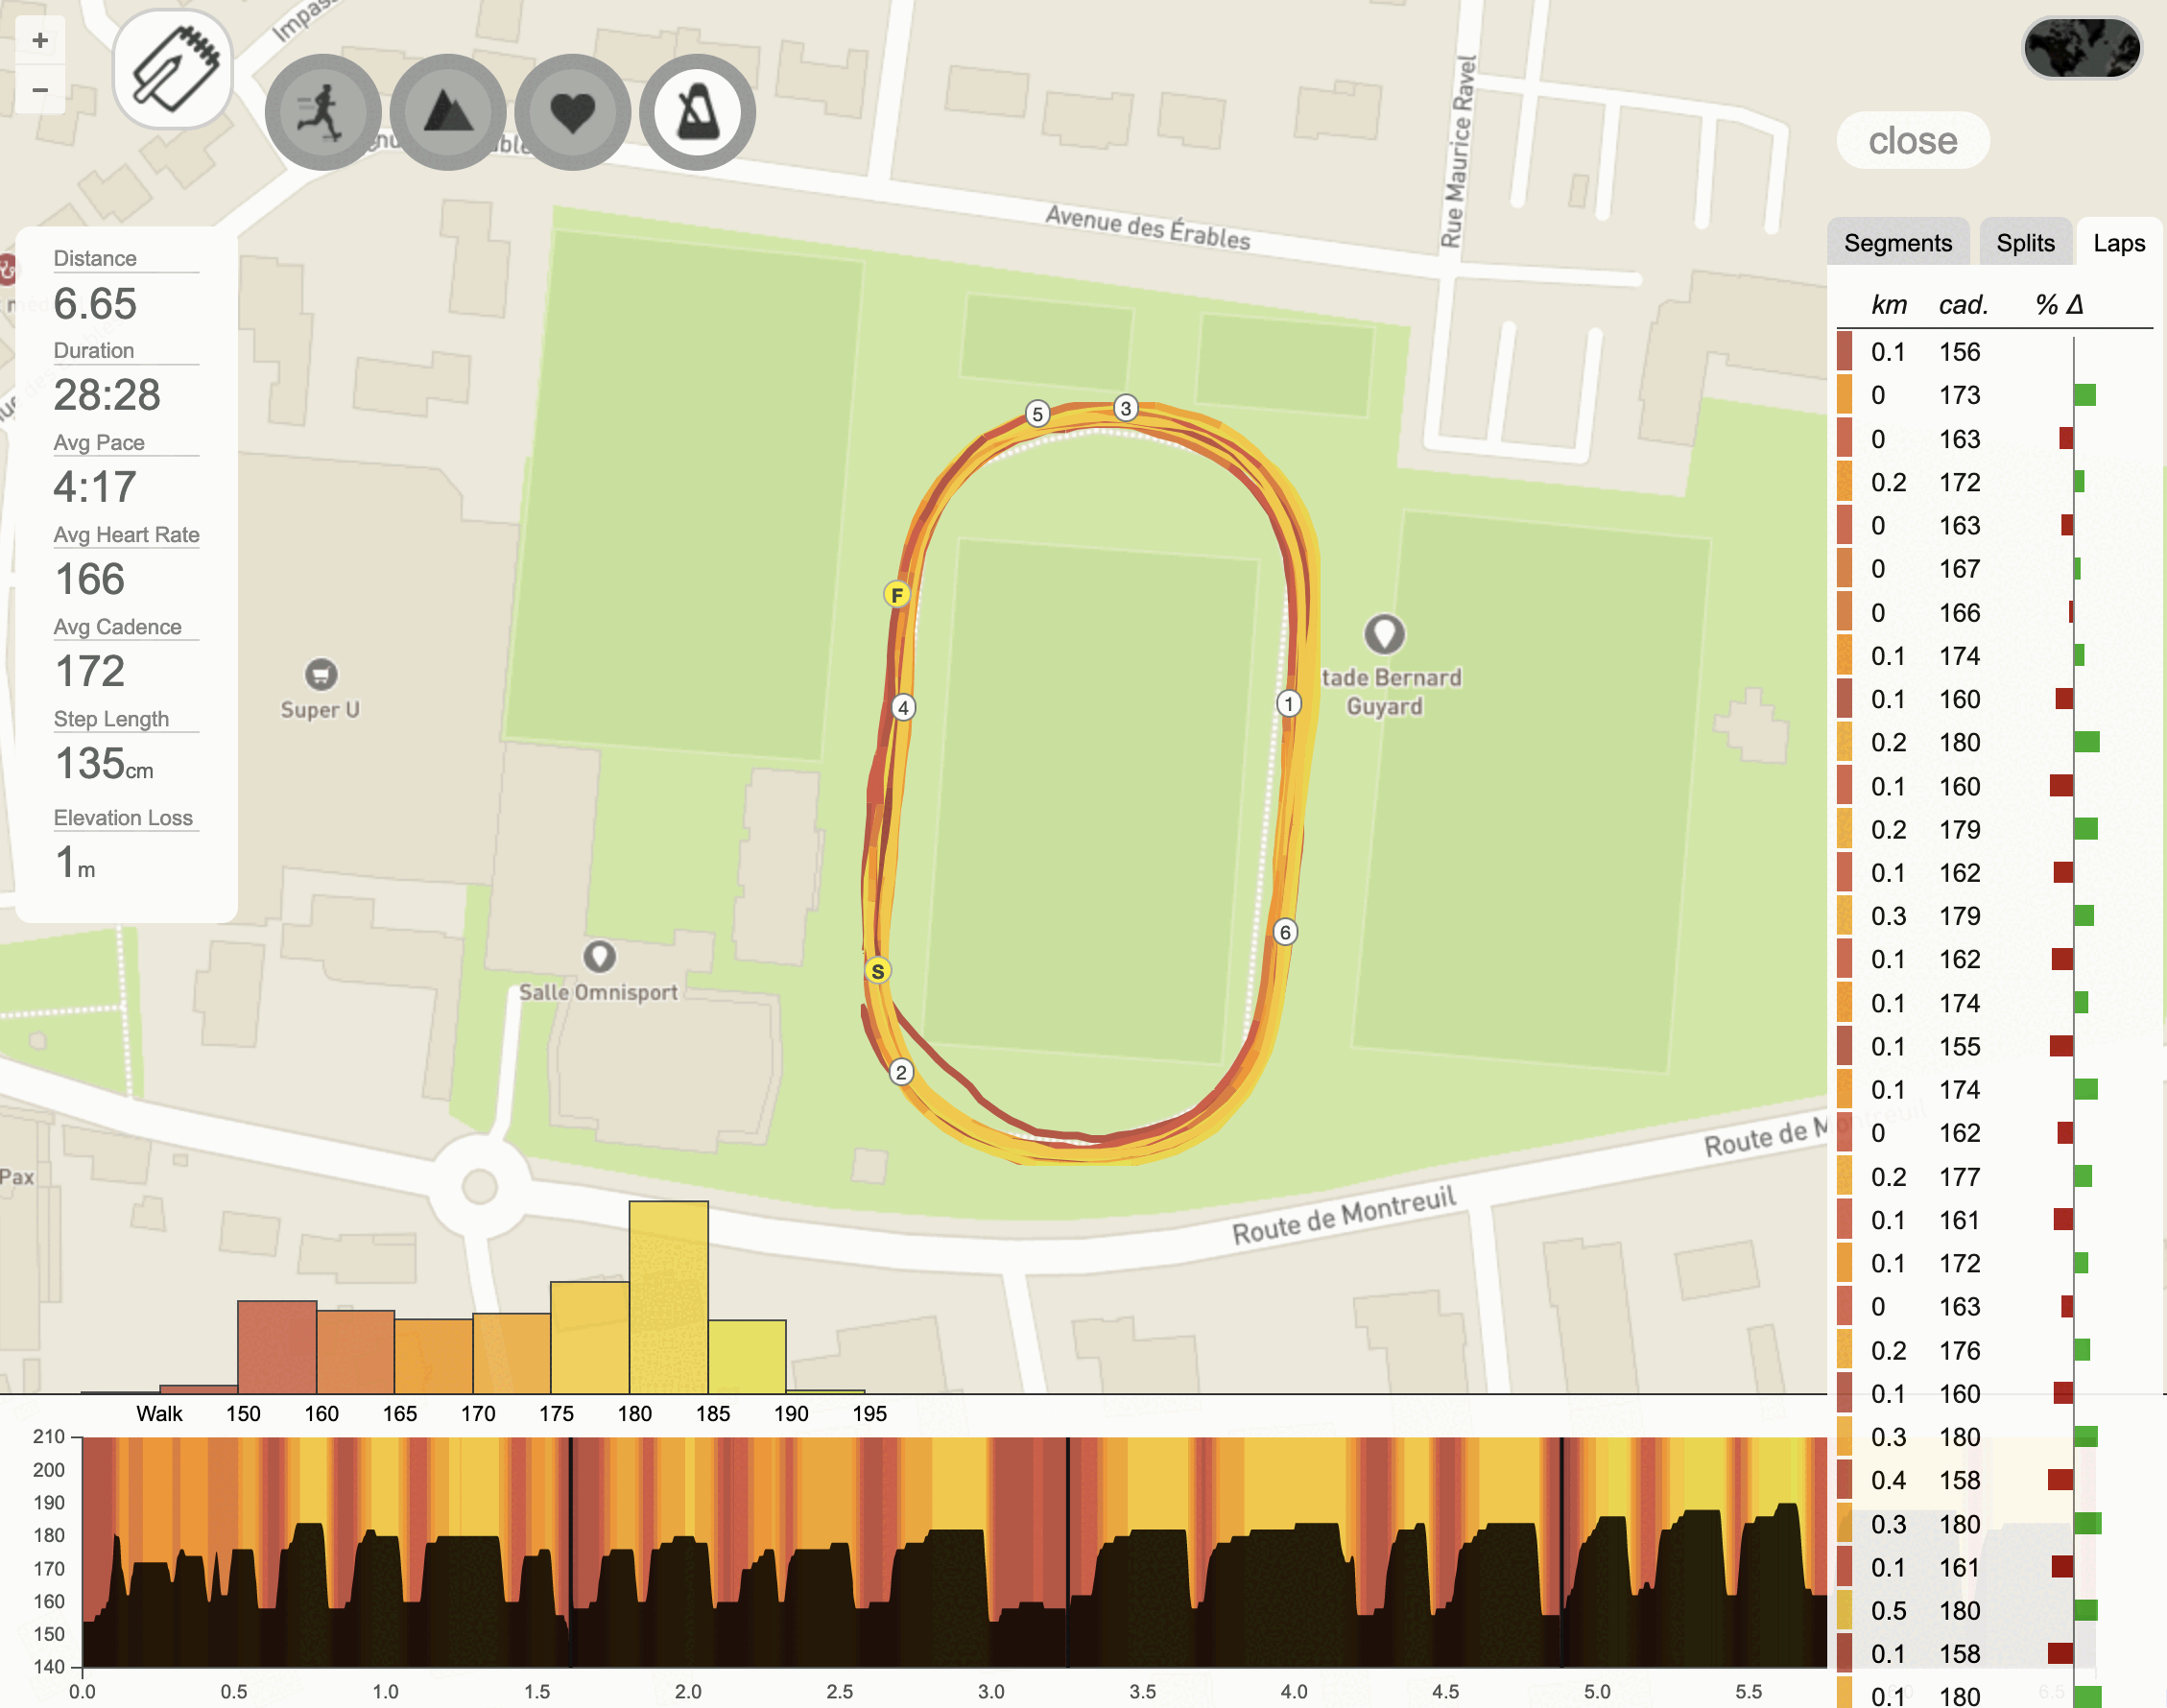
You can select a specific segment or lap to get even more details.
Let's say I want to see my detailed cadence on a specific lap - when I click on
this lap (list on the right), I get just that:
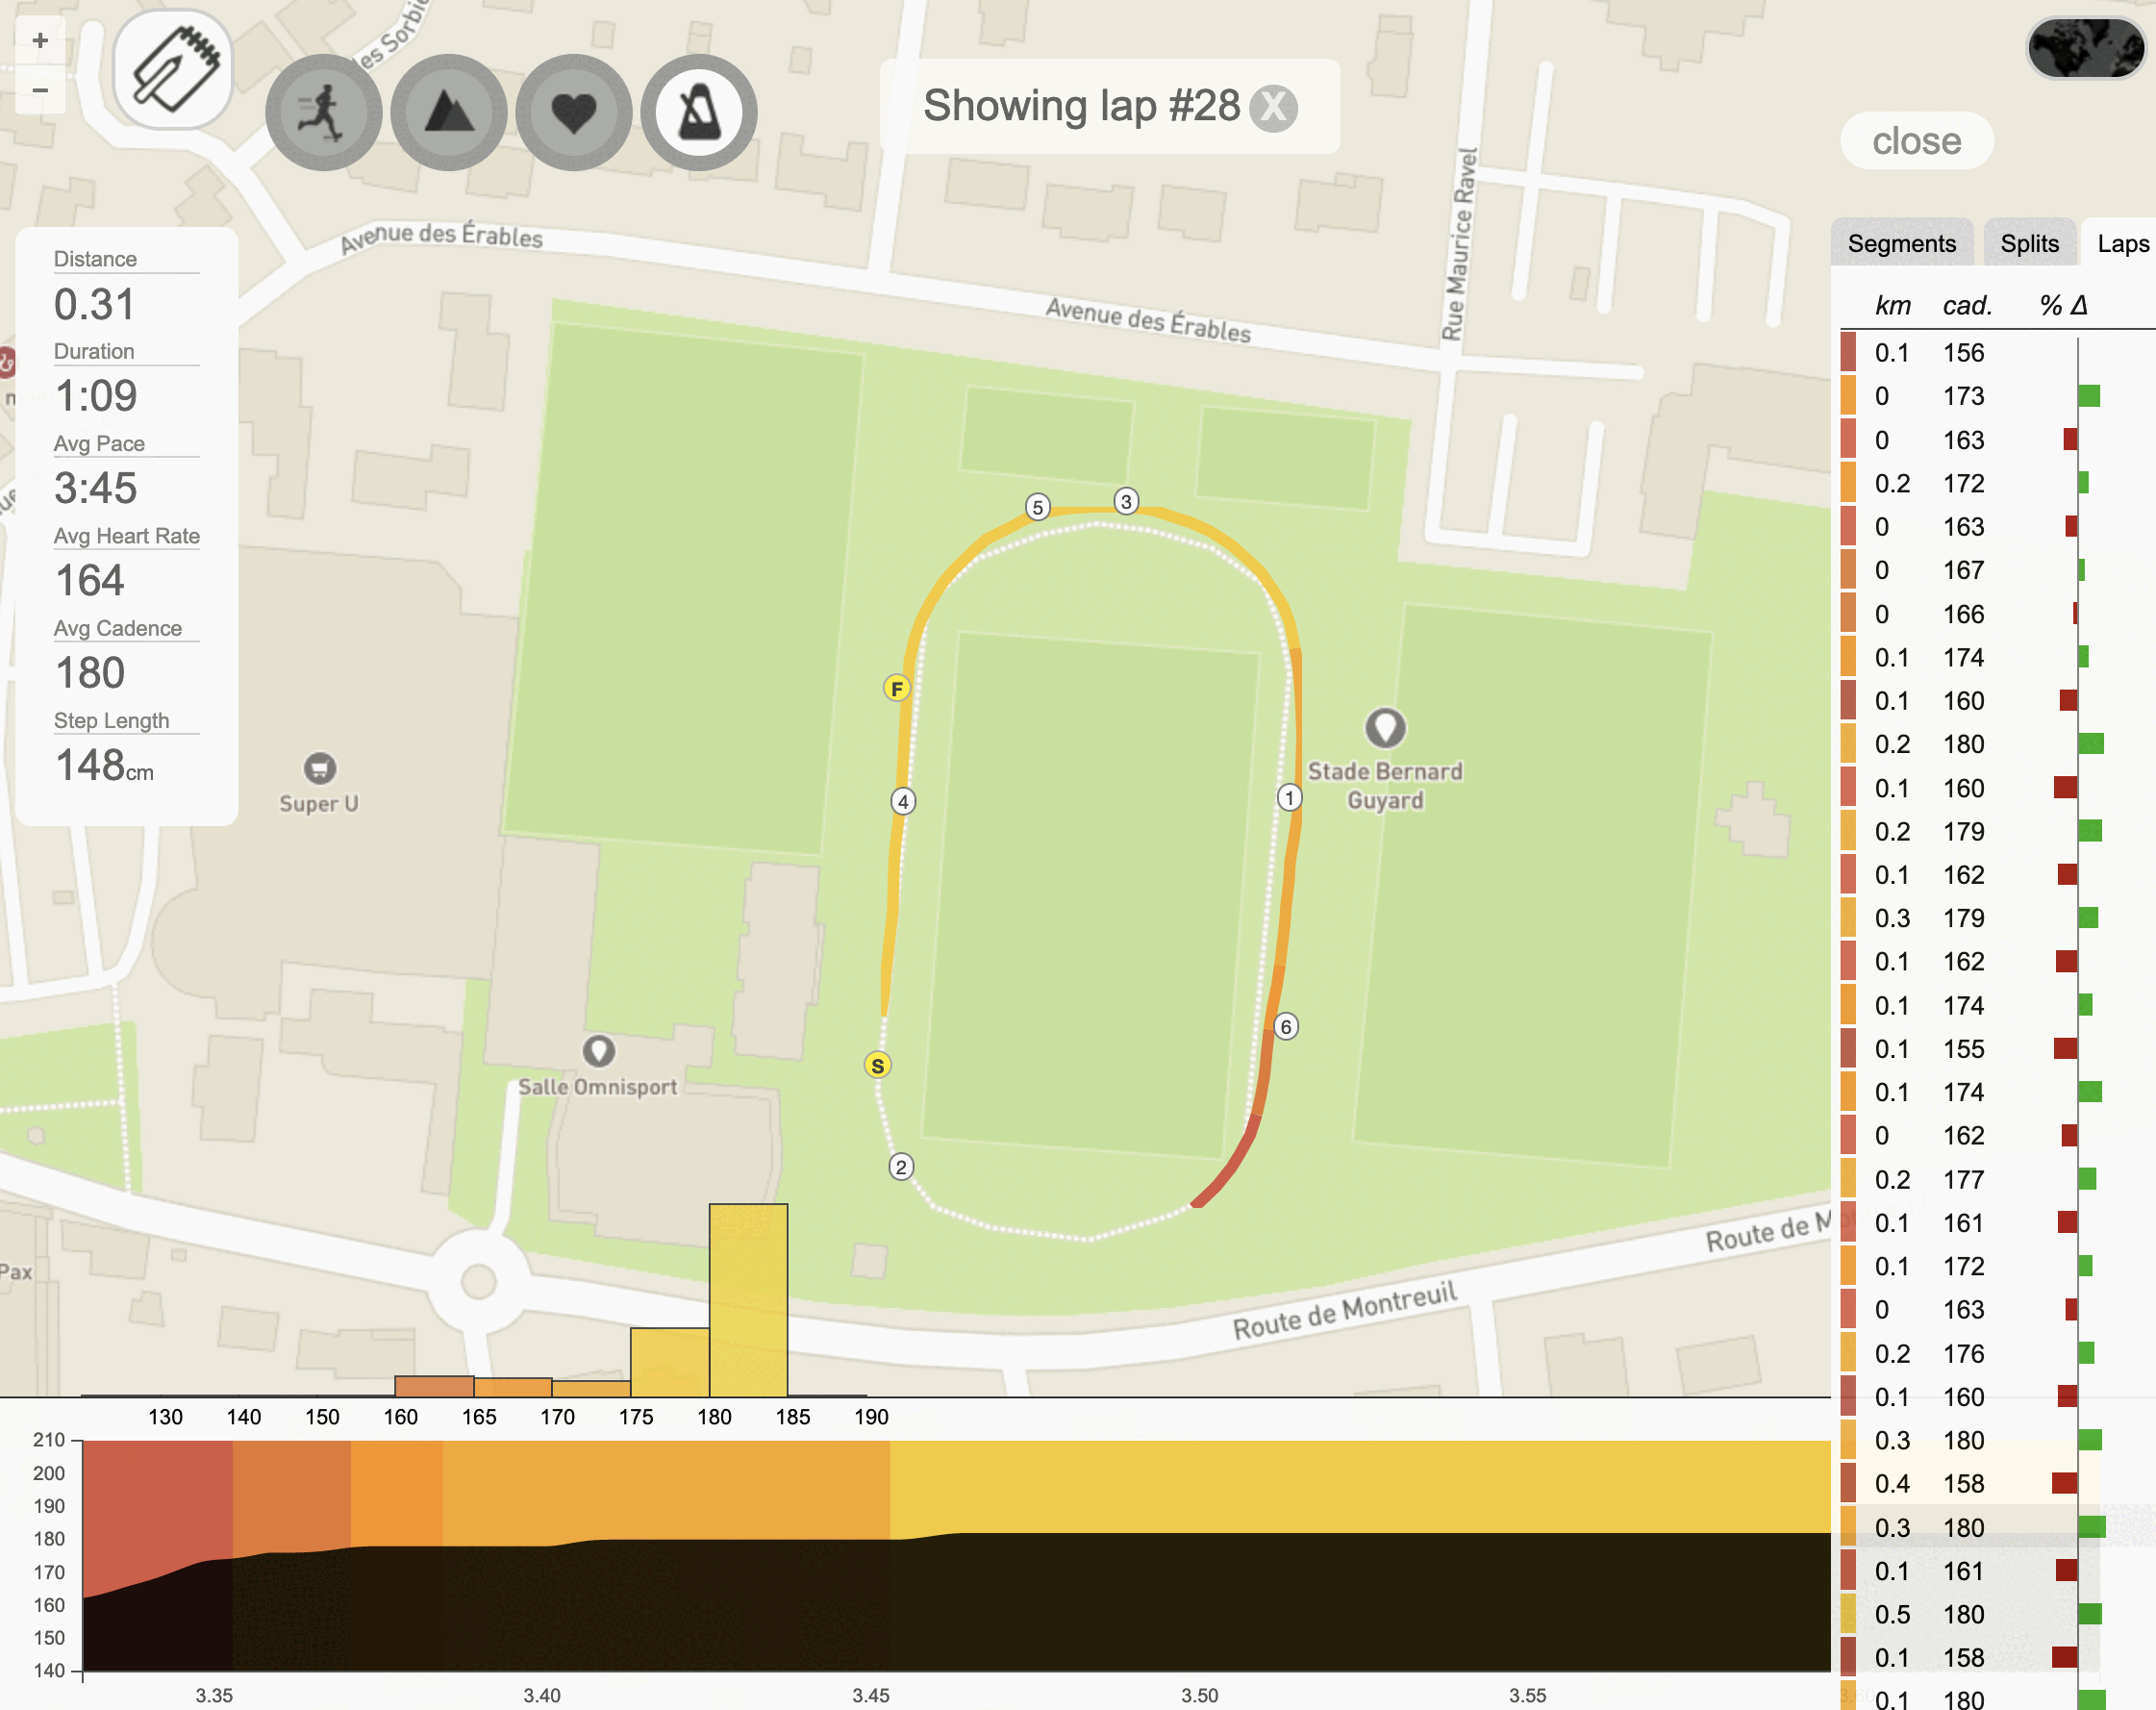
and by clicking the "notebook/pen" button, I can even add a comment:
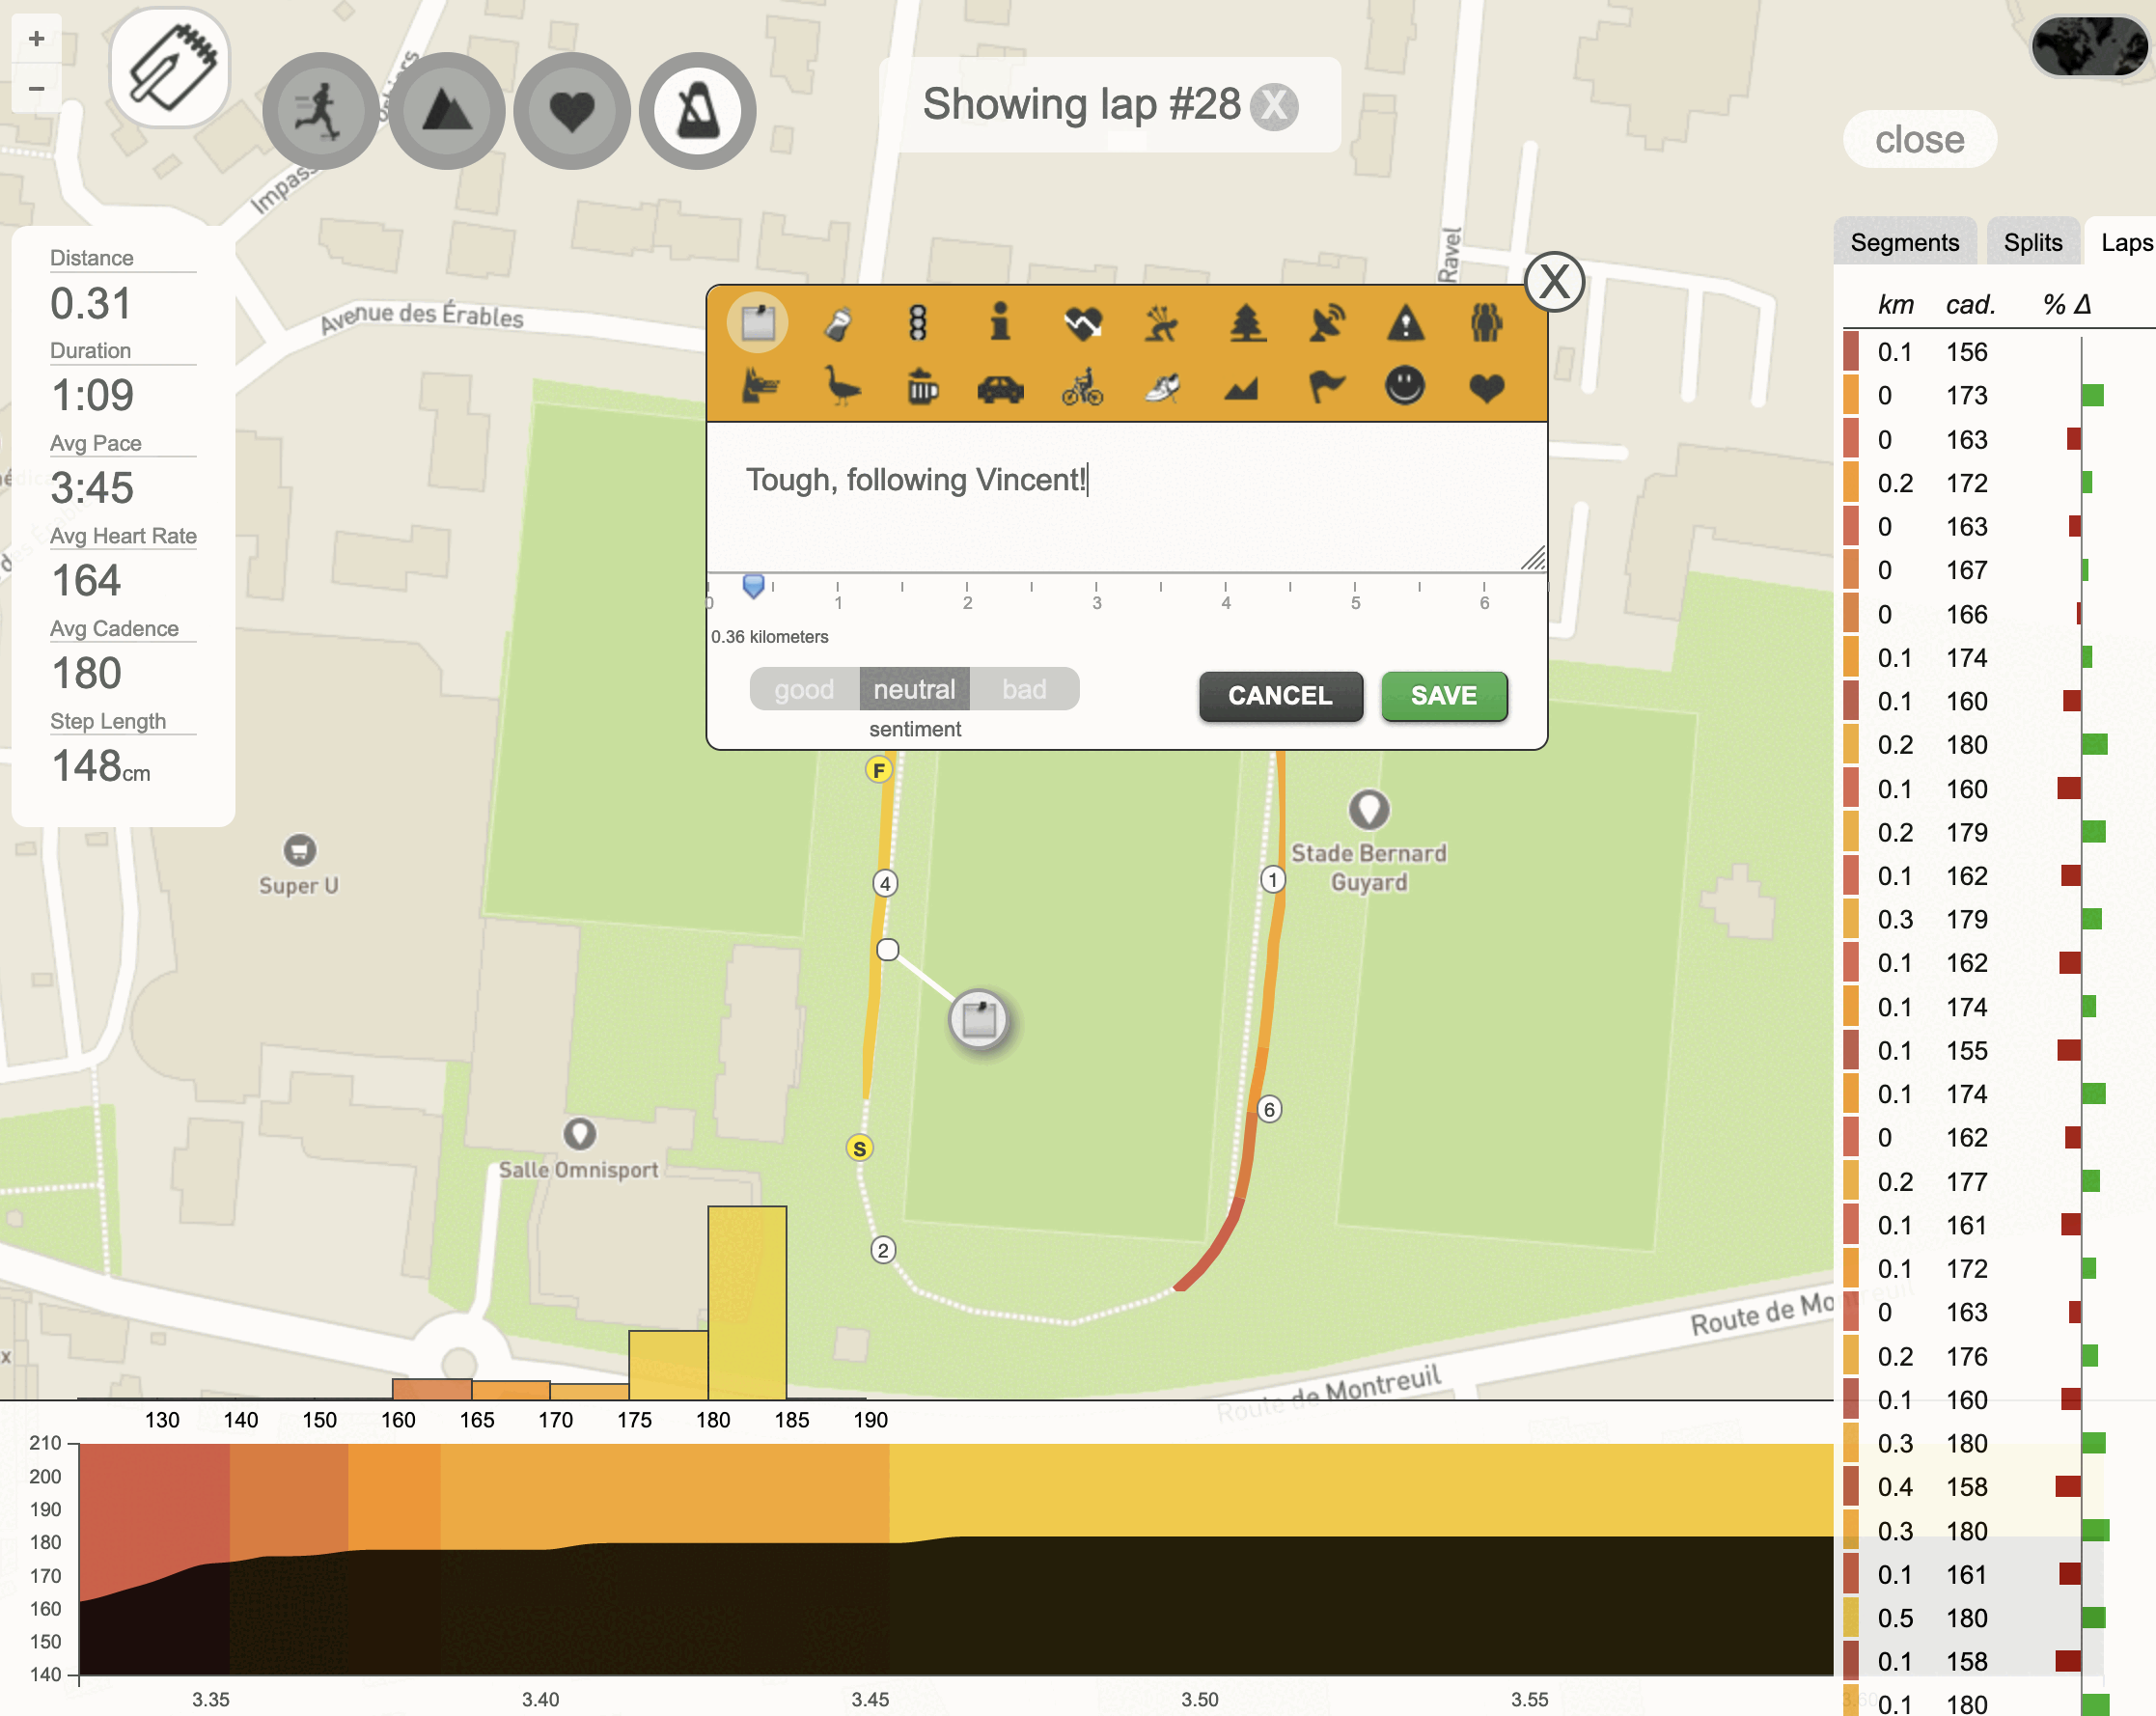
This is really one of the SmashRun features which I like and use the most - really allows you diving into a specific part of a run and get a lot of details, in a super easy and friendly manner.
"Analyze" (Pro feature)
Another useful feature is "Analyze", which you can access from any page.
Upon clicking on it, a popup appears with all your runs presented, with "Pace
Trends" shown by default:
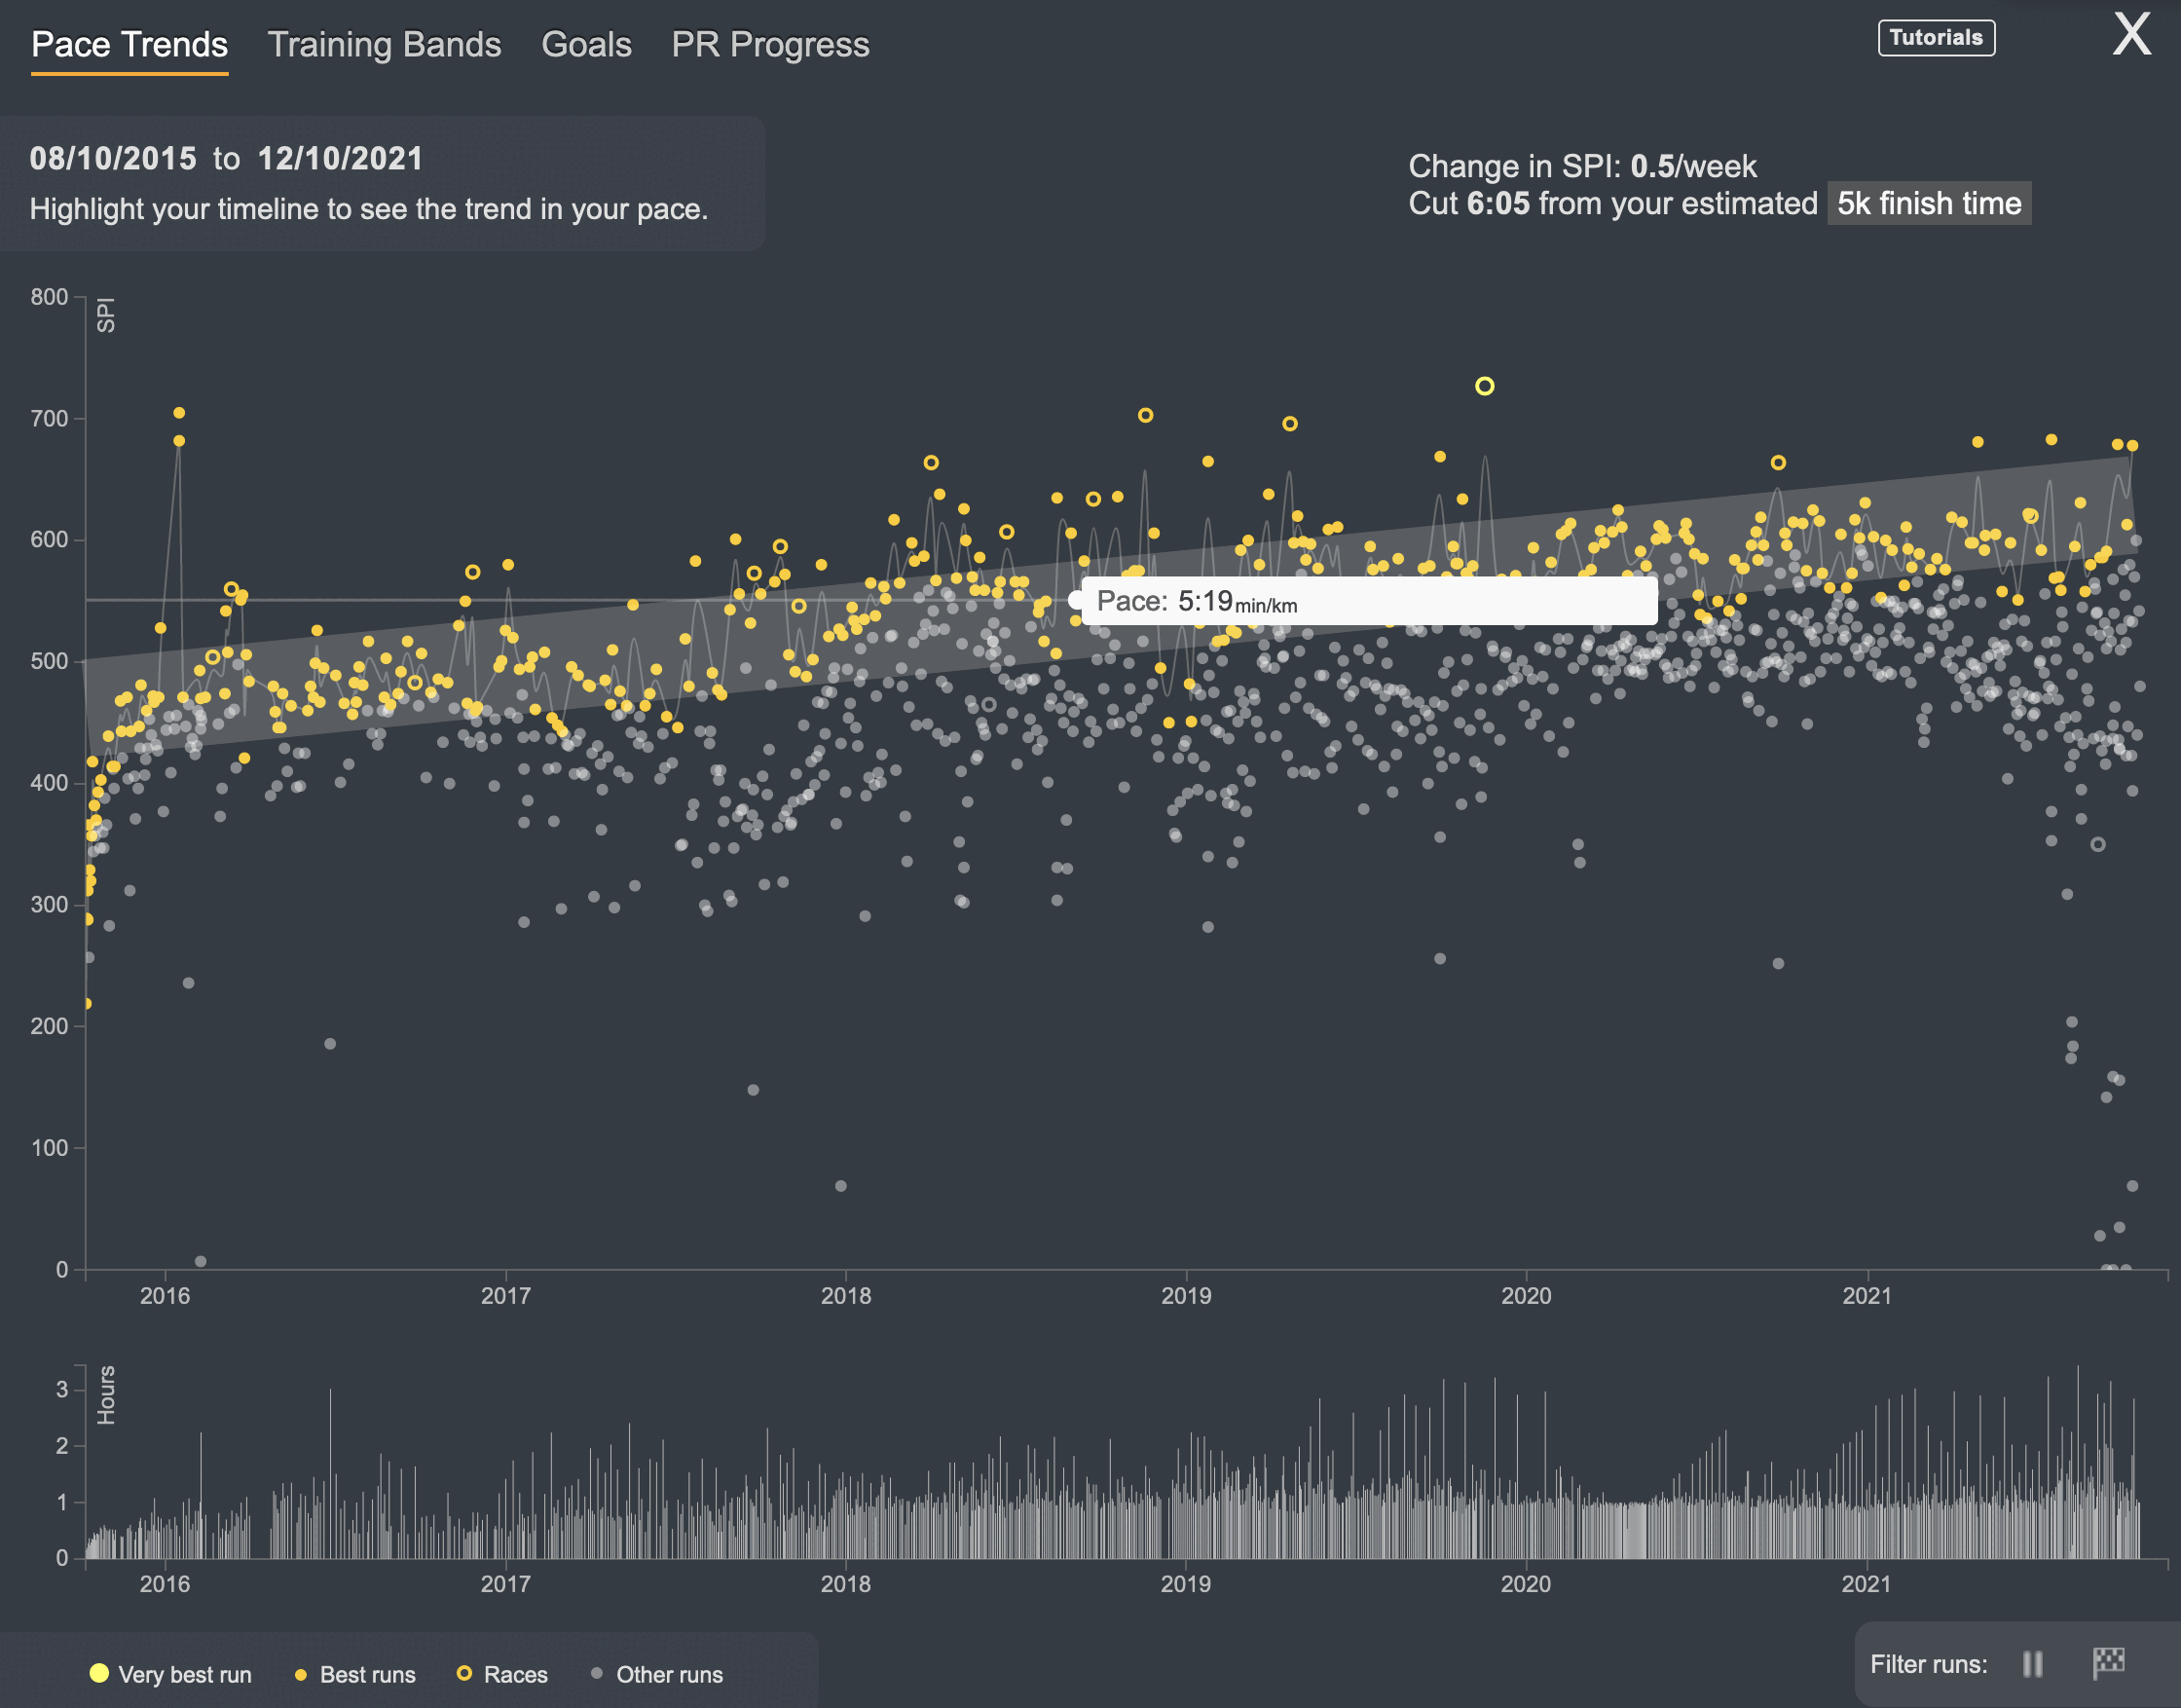
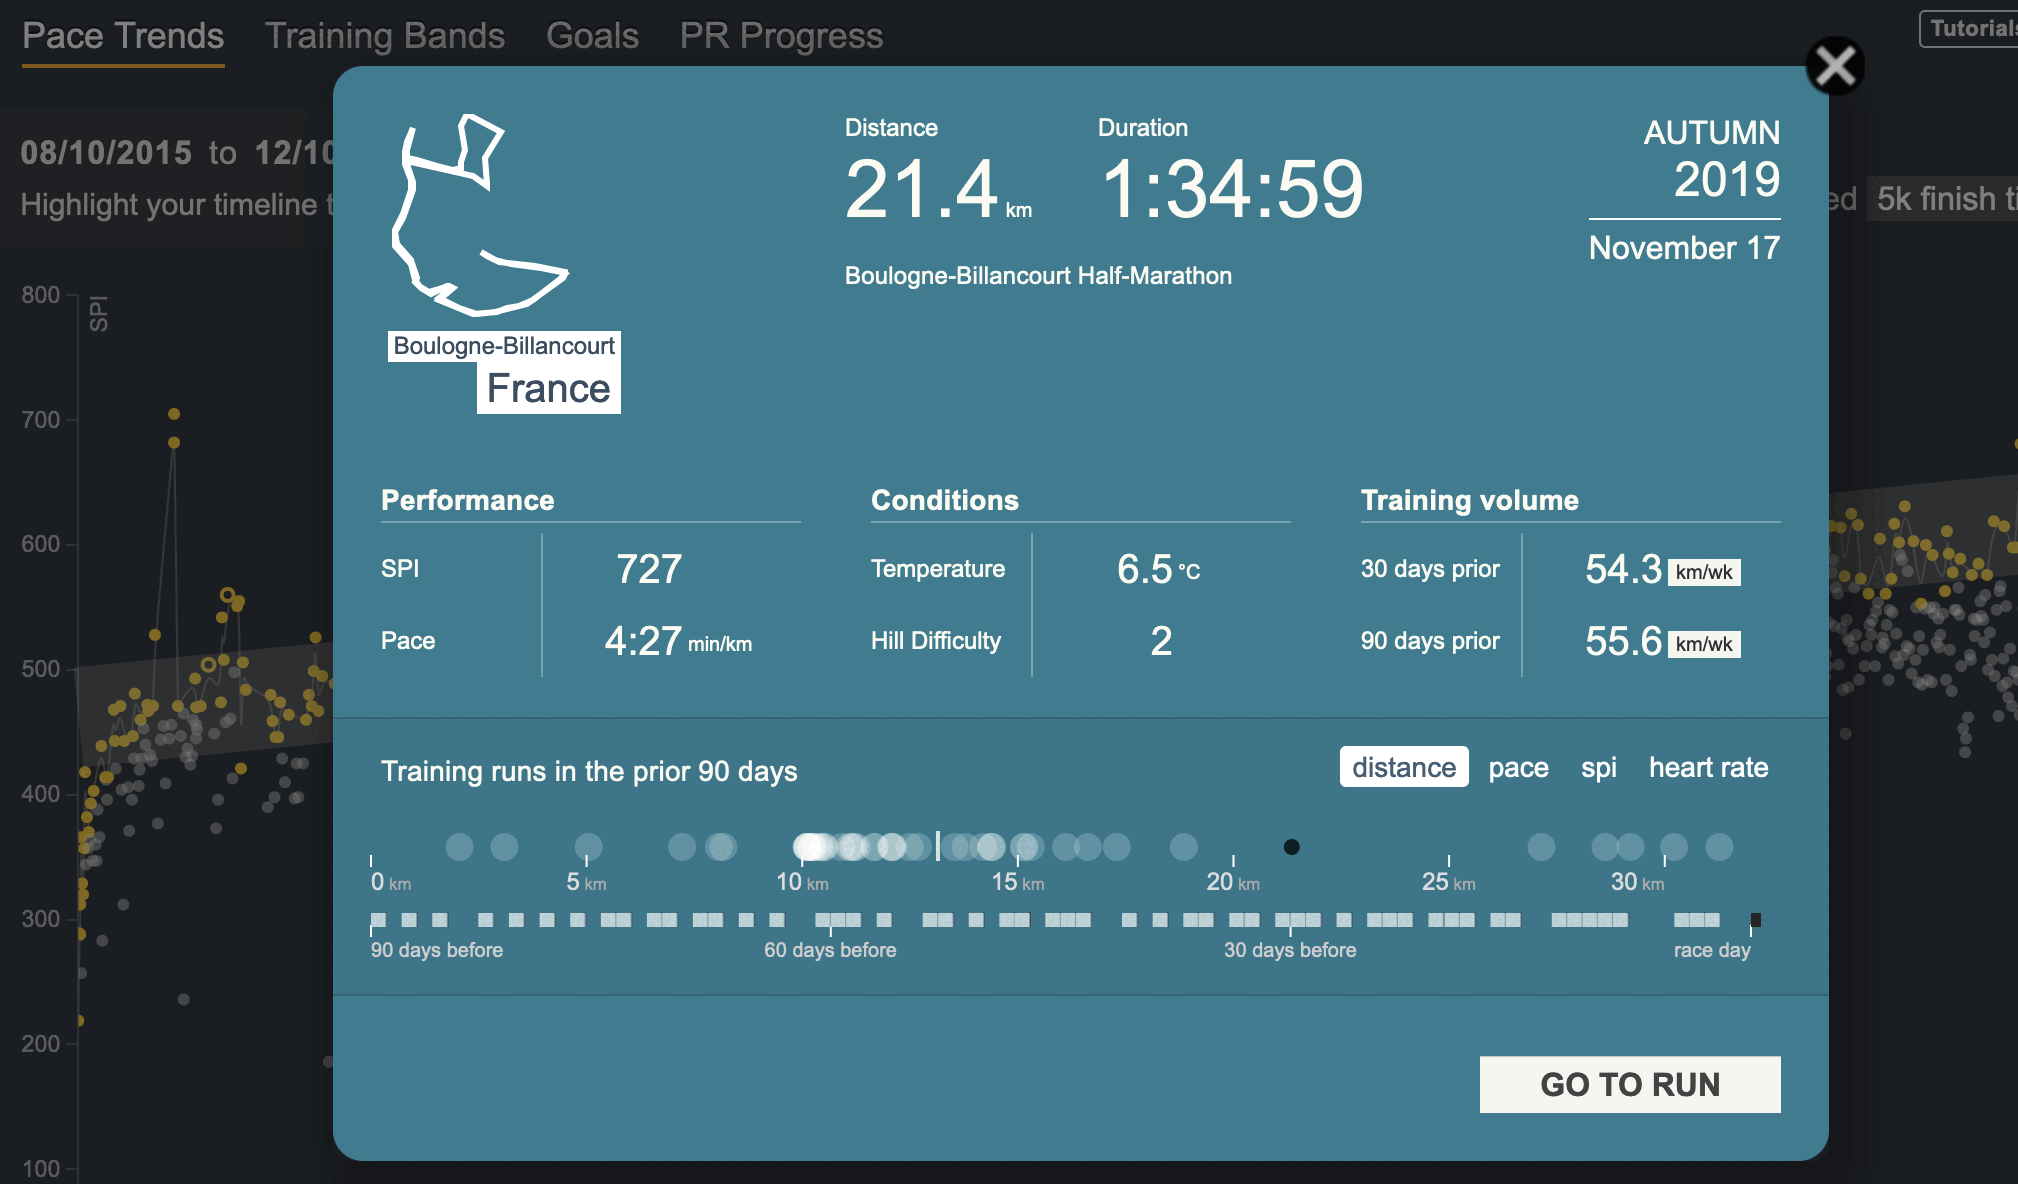
What this page does is showing you all of your runs and allowing you to "deep
dive" on e.g. your pace.
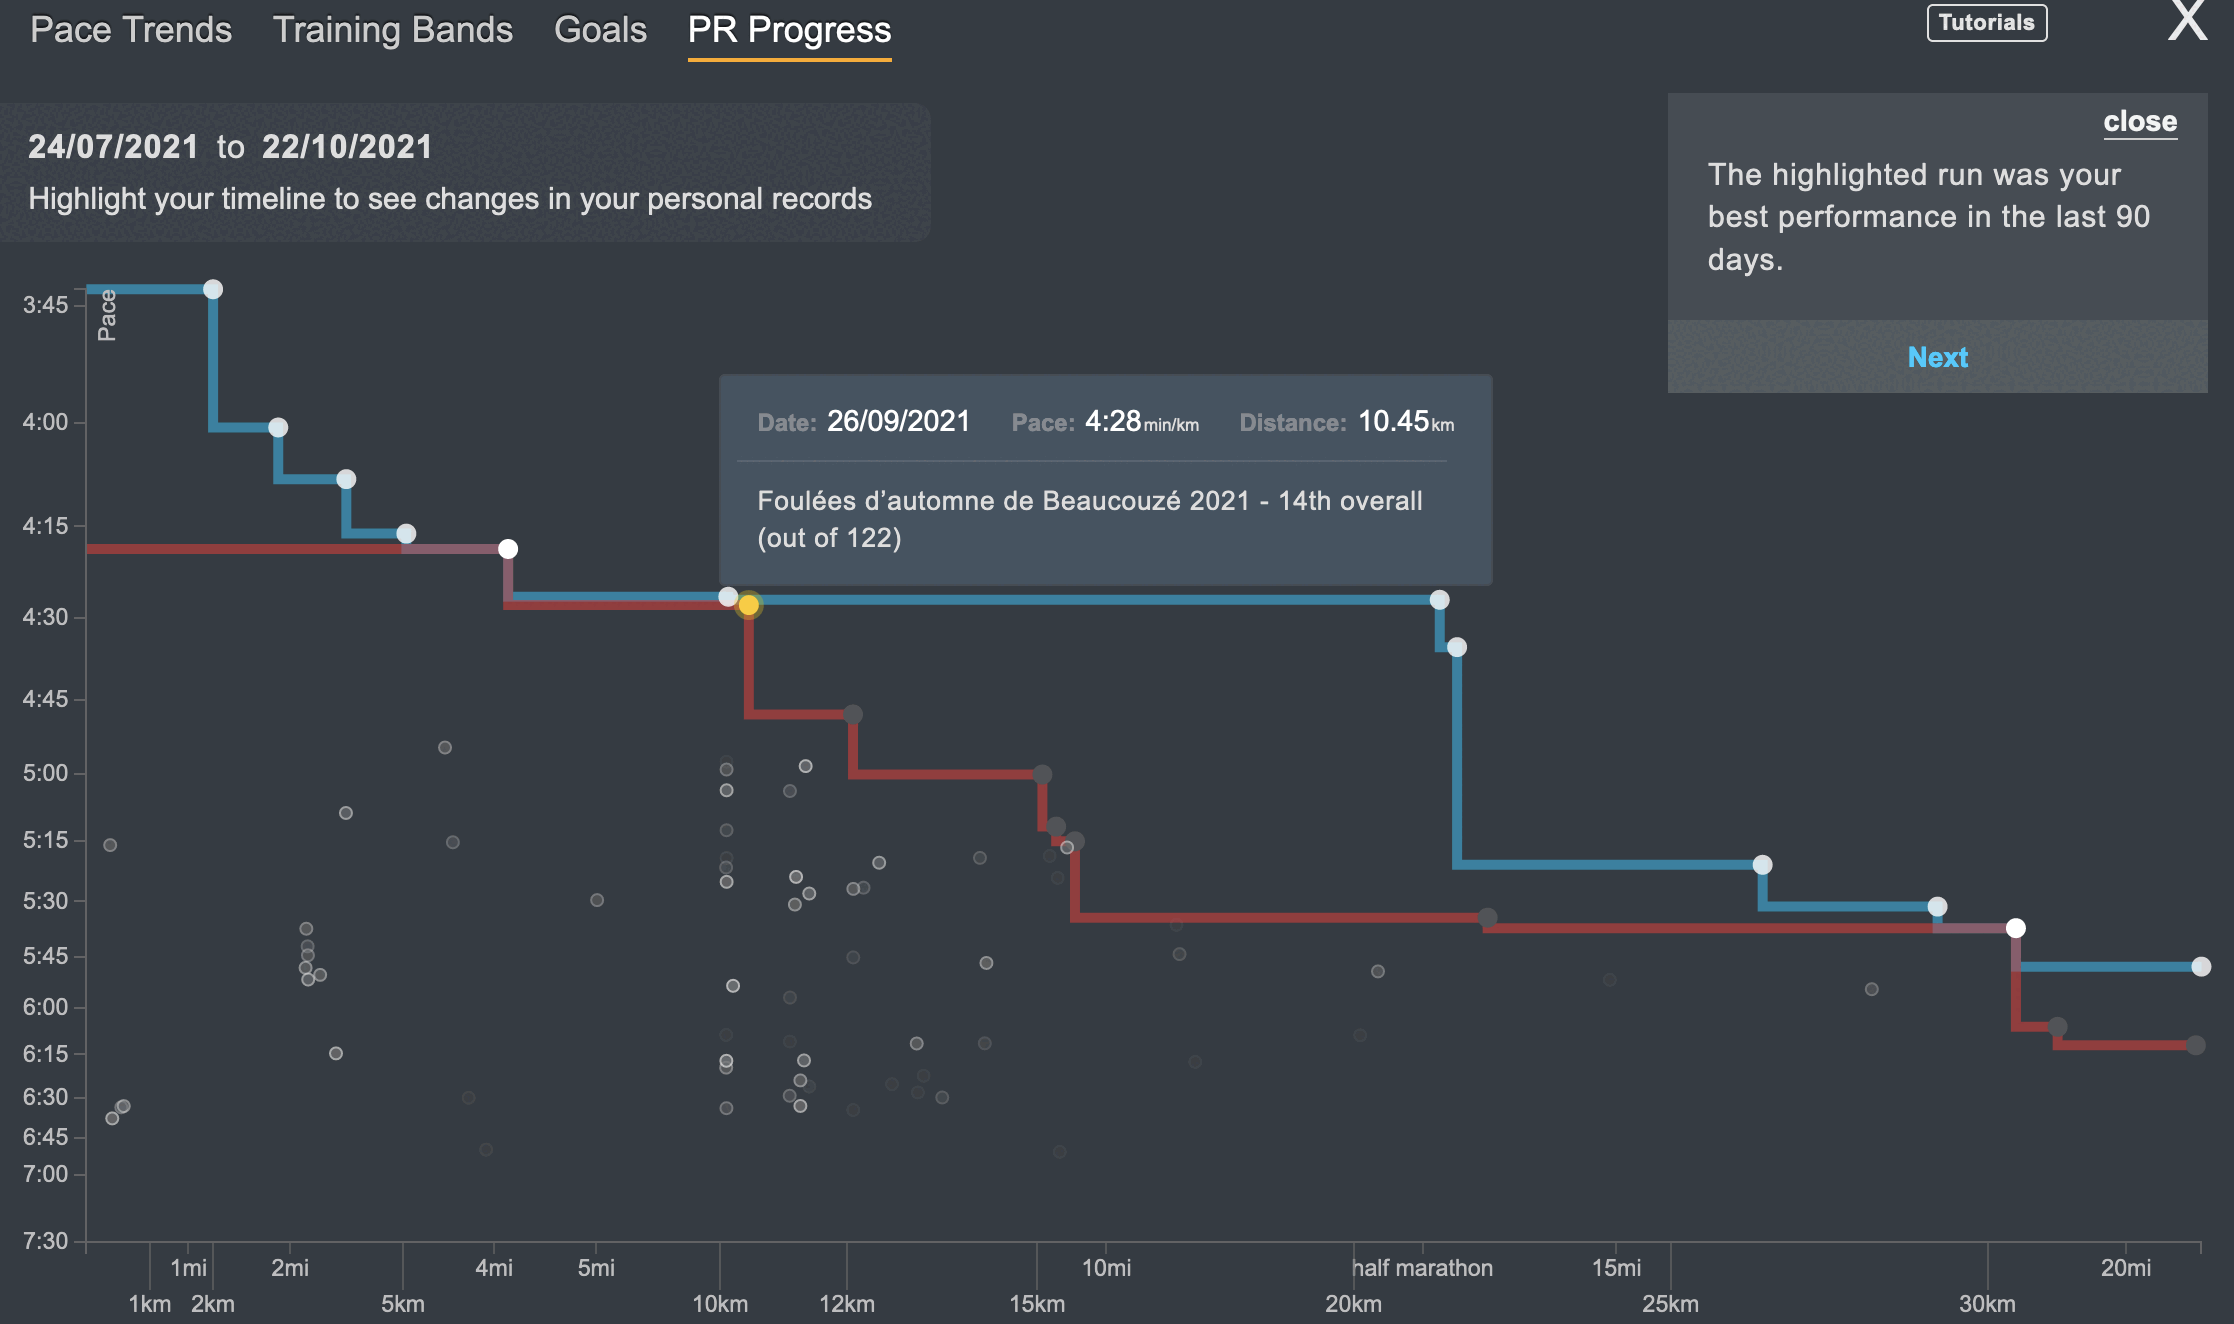
As you can see above, this shows my pace over time, and if there's a specific
run I'm interested in, I can click on it, get some details about it, including
the runs I did up to 90 days before this run, with breakdown by distance, pace,
SPI and HR - giving you a chance to see if increasing your distance or pace
helped in any way:
In addition to Pace Trends, there are 3 other screens available:
- Training Bands
- Goals
- PR Progress
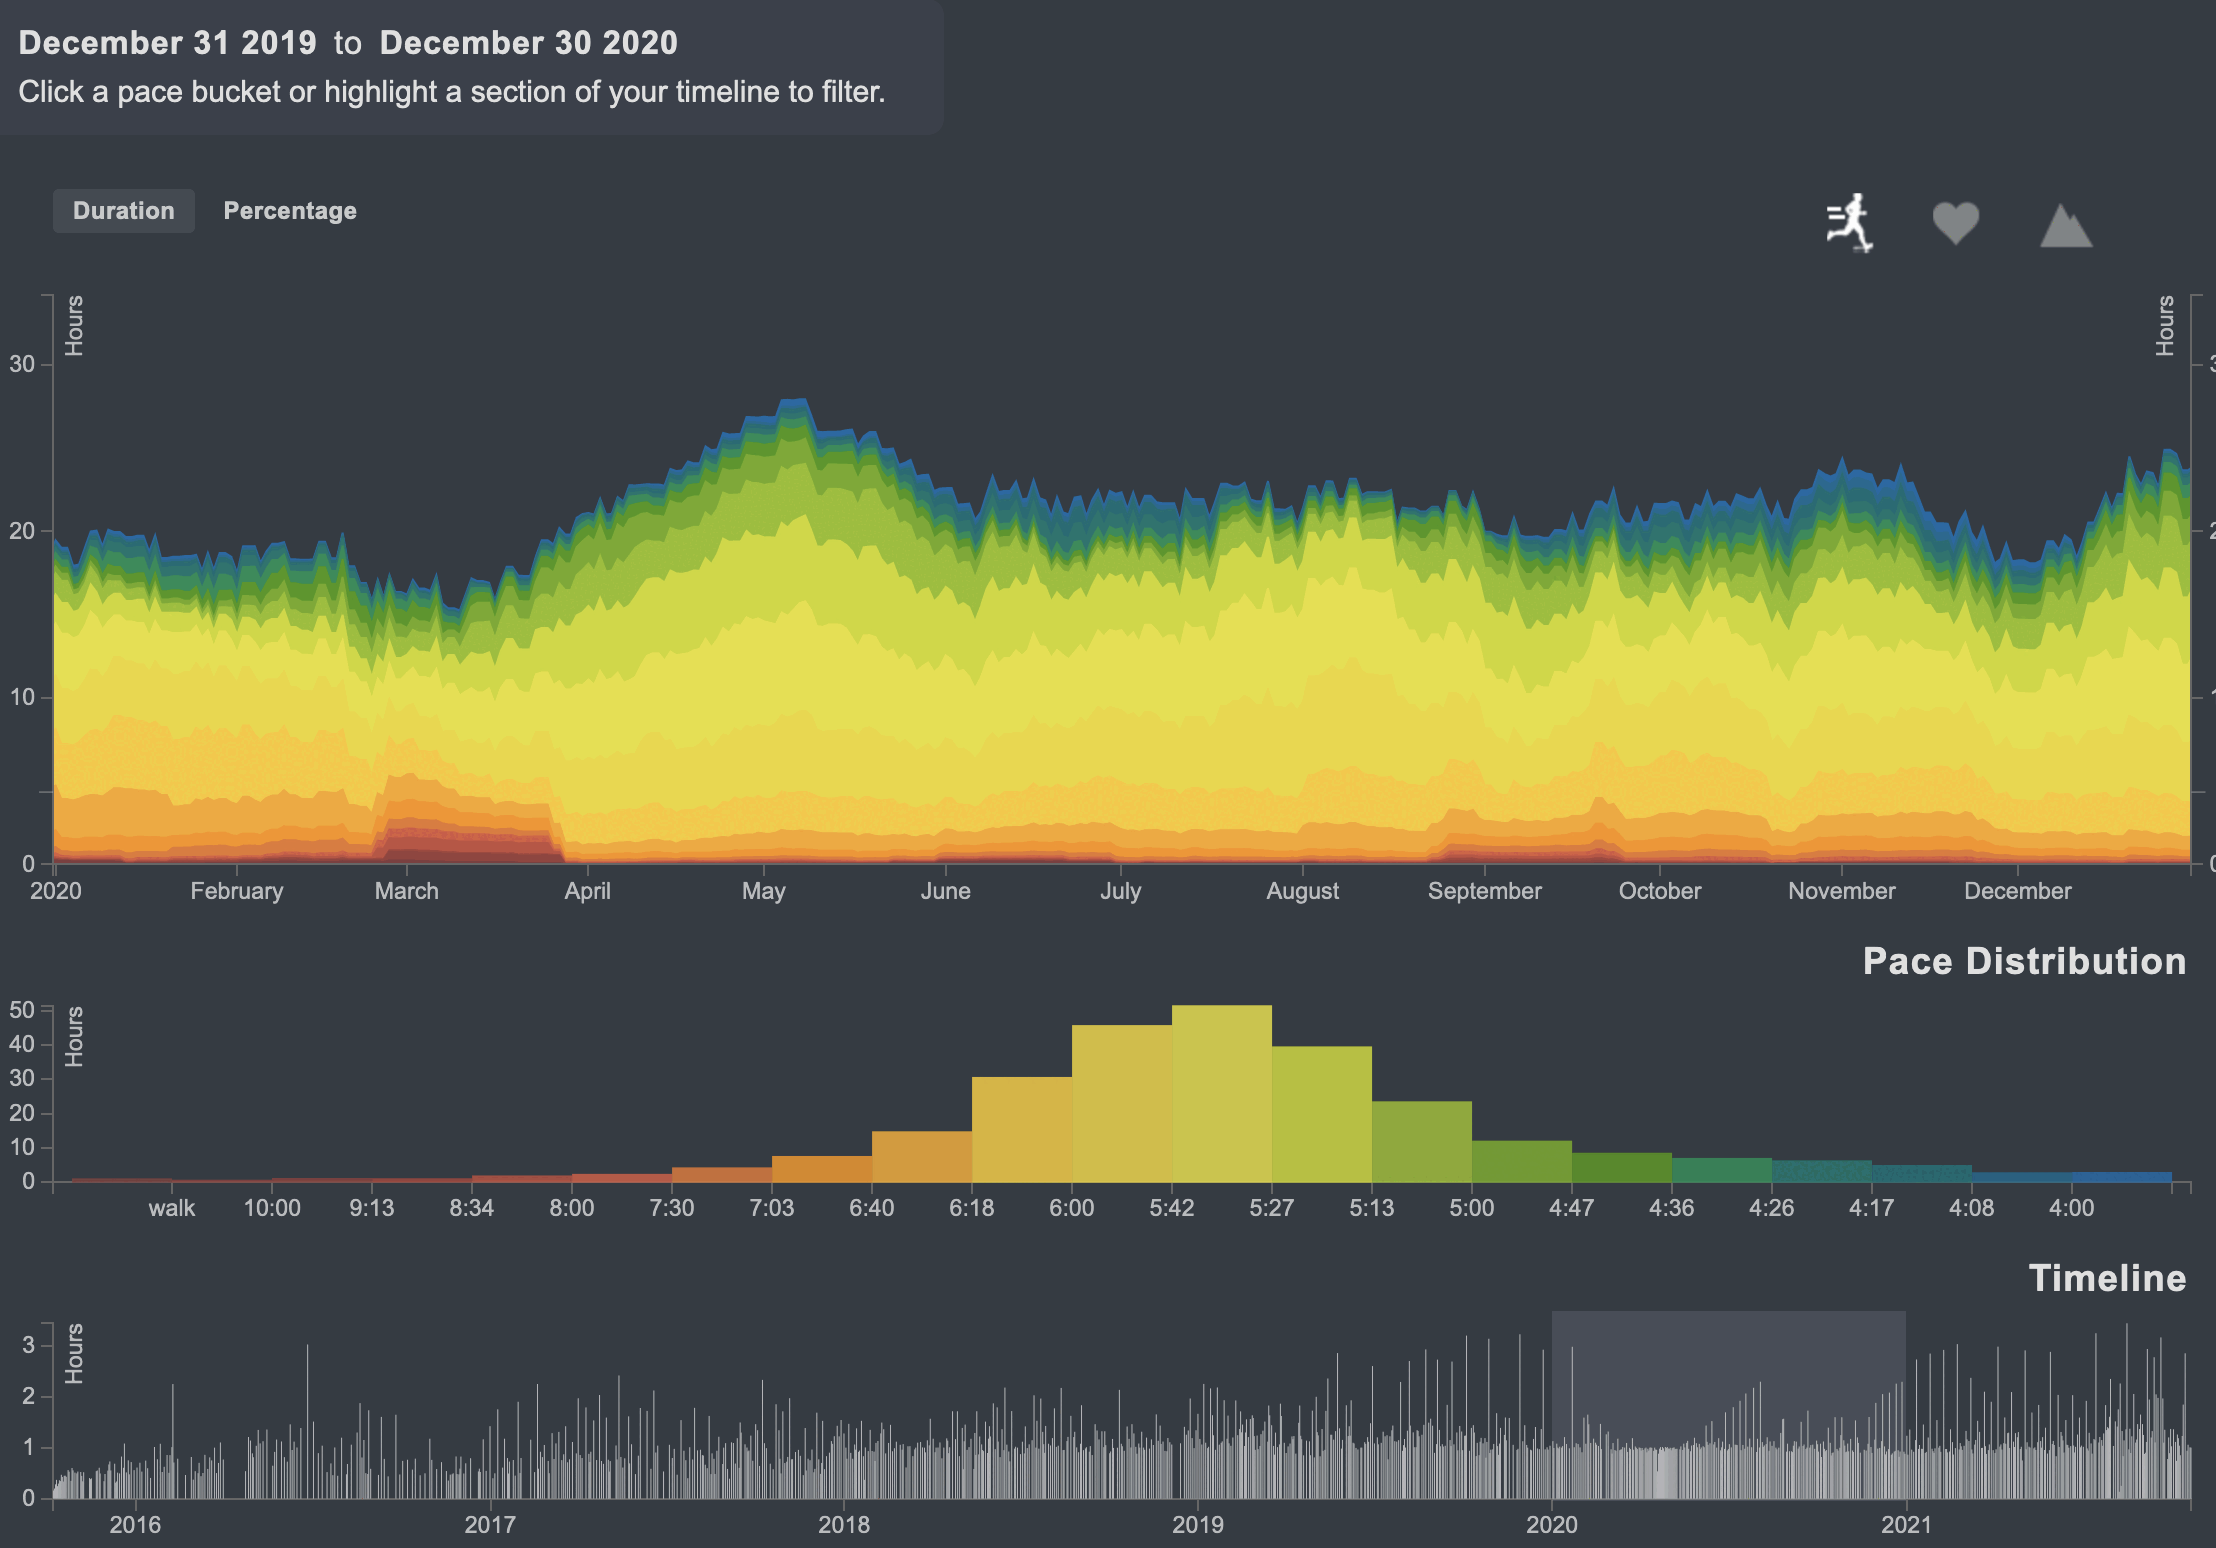
Training Bands allows getting a better idea about how your overall training is going, whether you increased or decreased it, how hard you're training, looking at your speed, heart rate or elevation.
From SmashRun FAQ:
"A training band is the sum of all the time you've ever spent running at a
specific pace, HR zone, or hill grade"
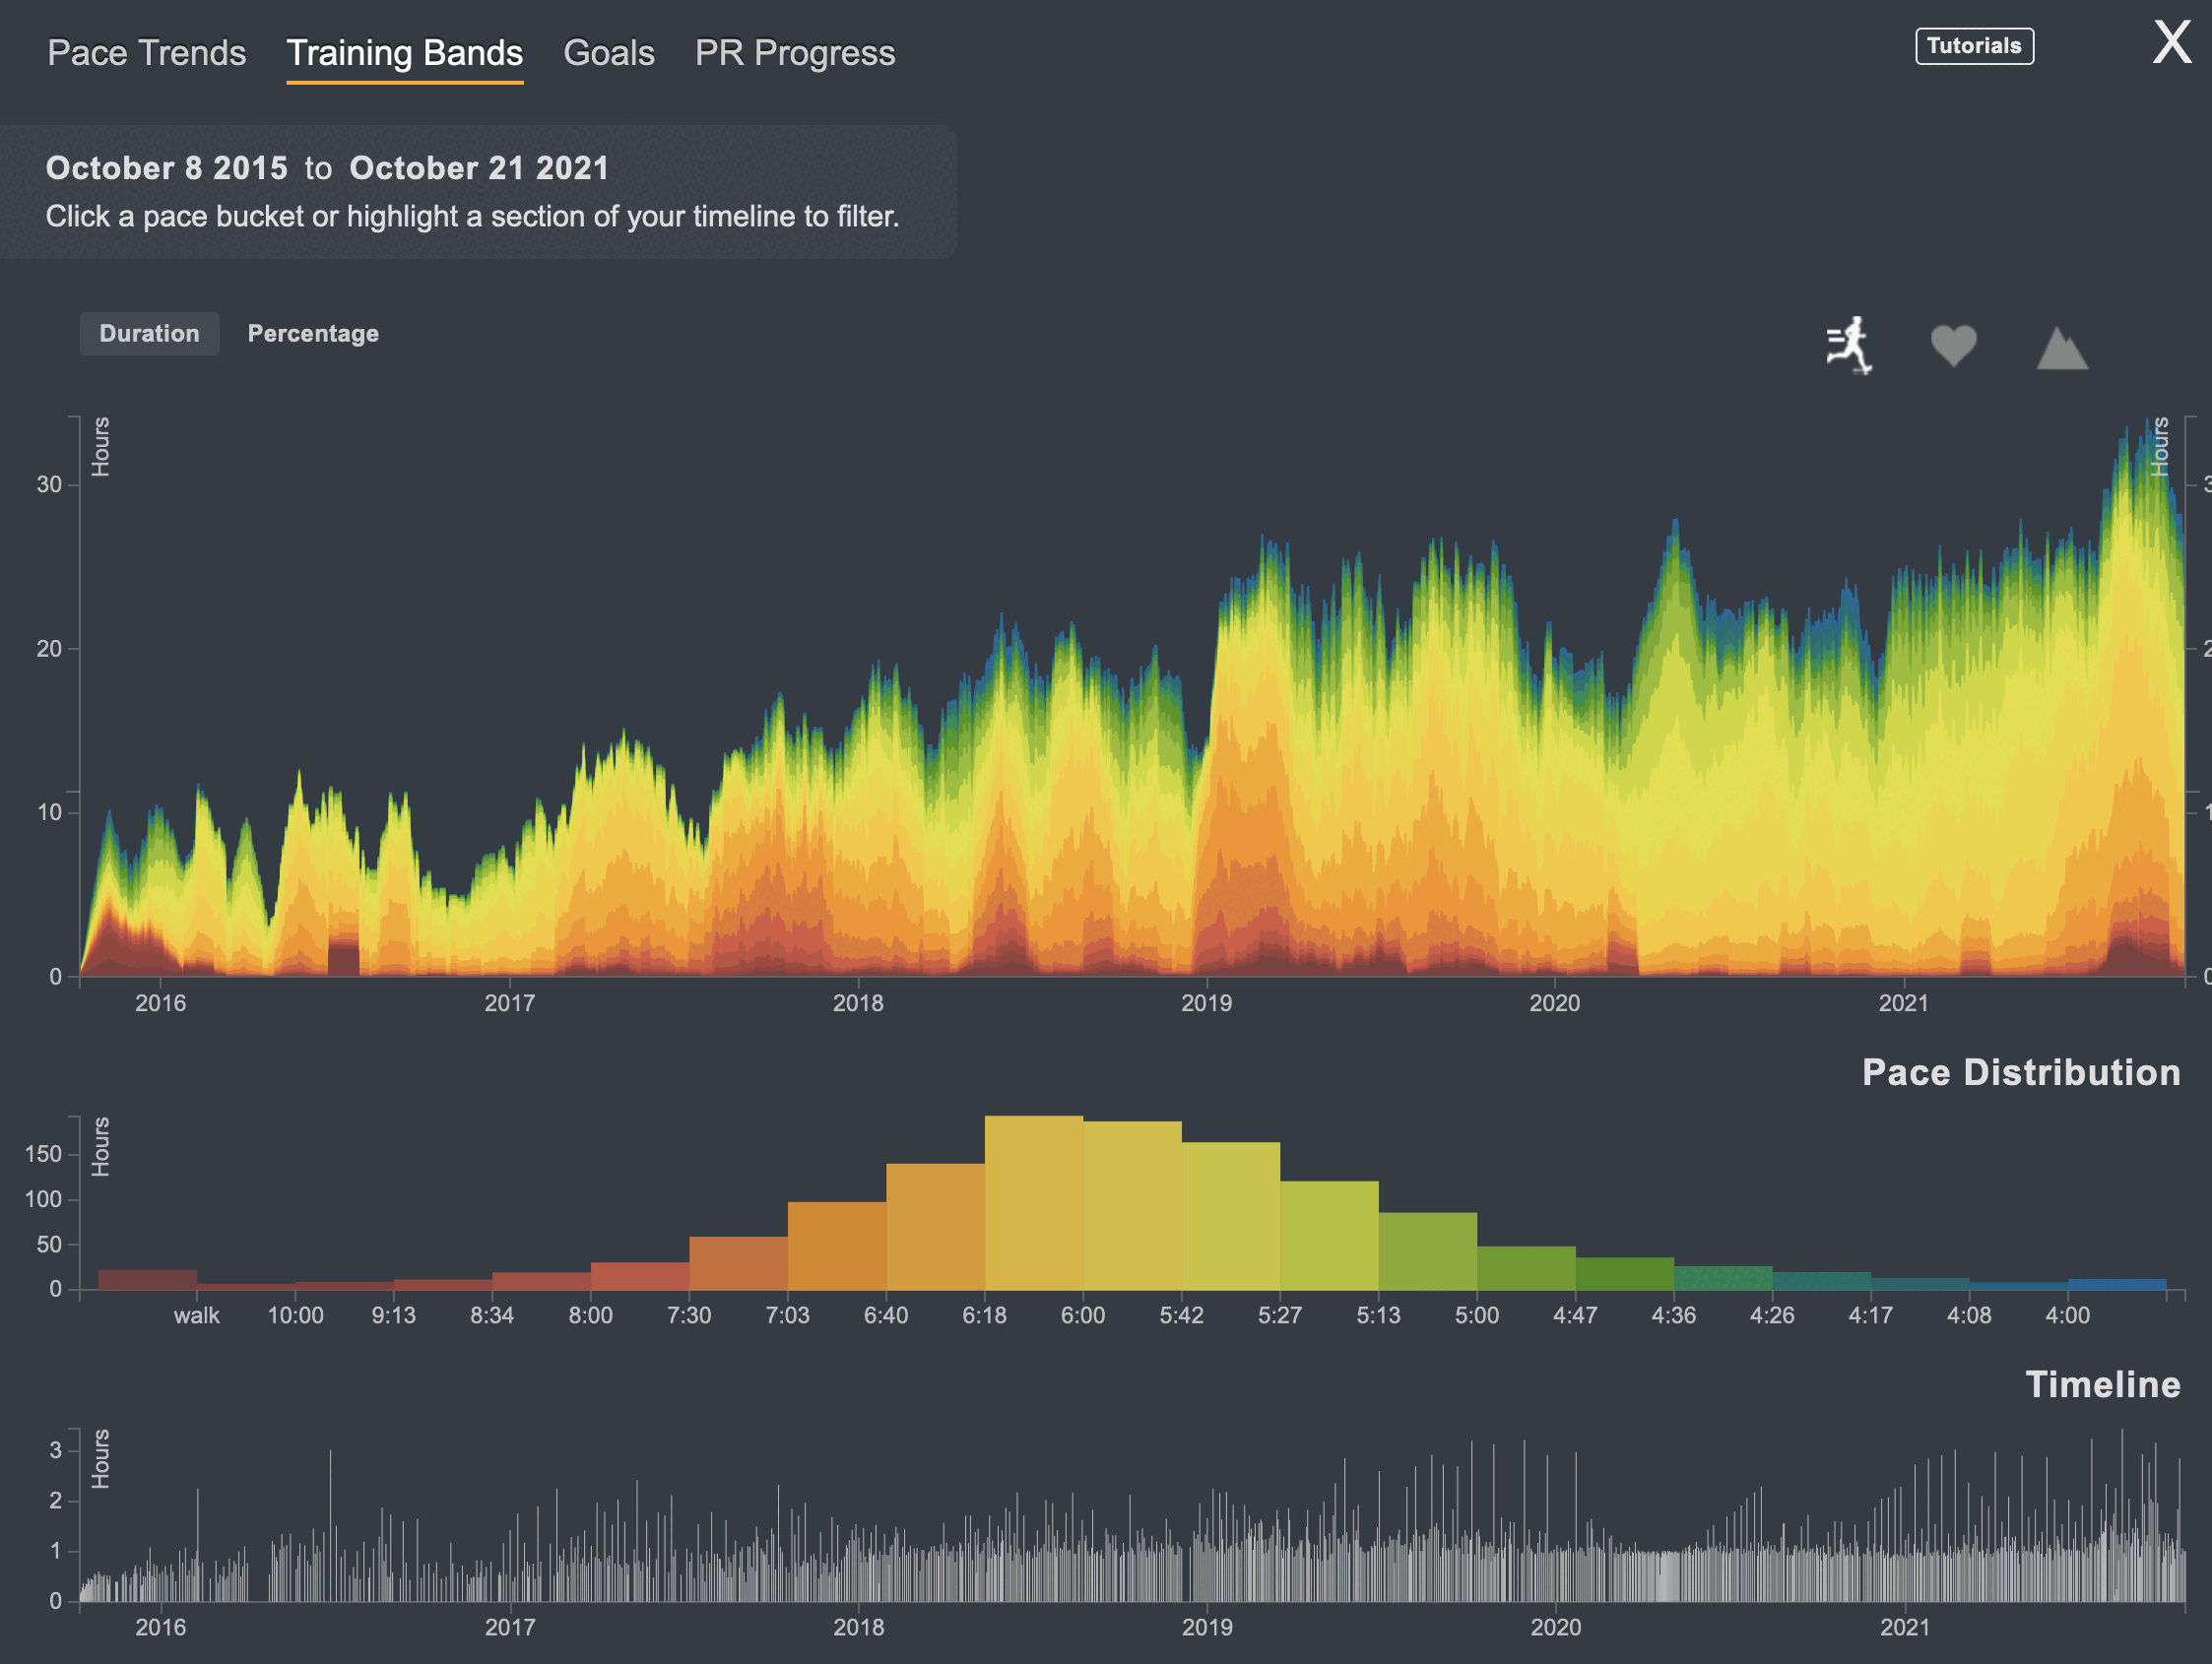
Using the "Timeline" part at the bottom, you can select which time window you want to focus on, and slide it.
For instance, you can see above that I increased my training load compared to e.g. 2015, but if I want to find out more precisely what my training load has been in say 2020, I can easily zoom in:
Goals allows you defining a target per month or per year (e.g. "I'll run 200 Kms in November" or "I'll run 2.000 Kms in 2021", and keeping track of those goals:
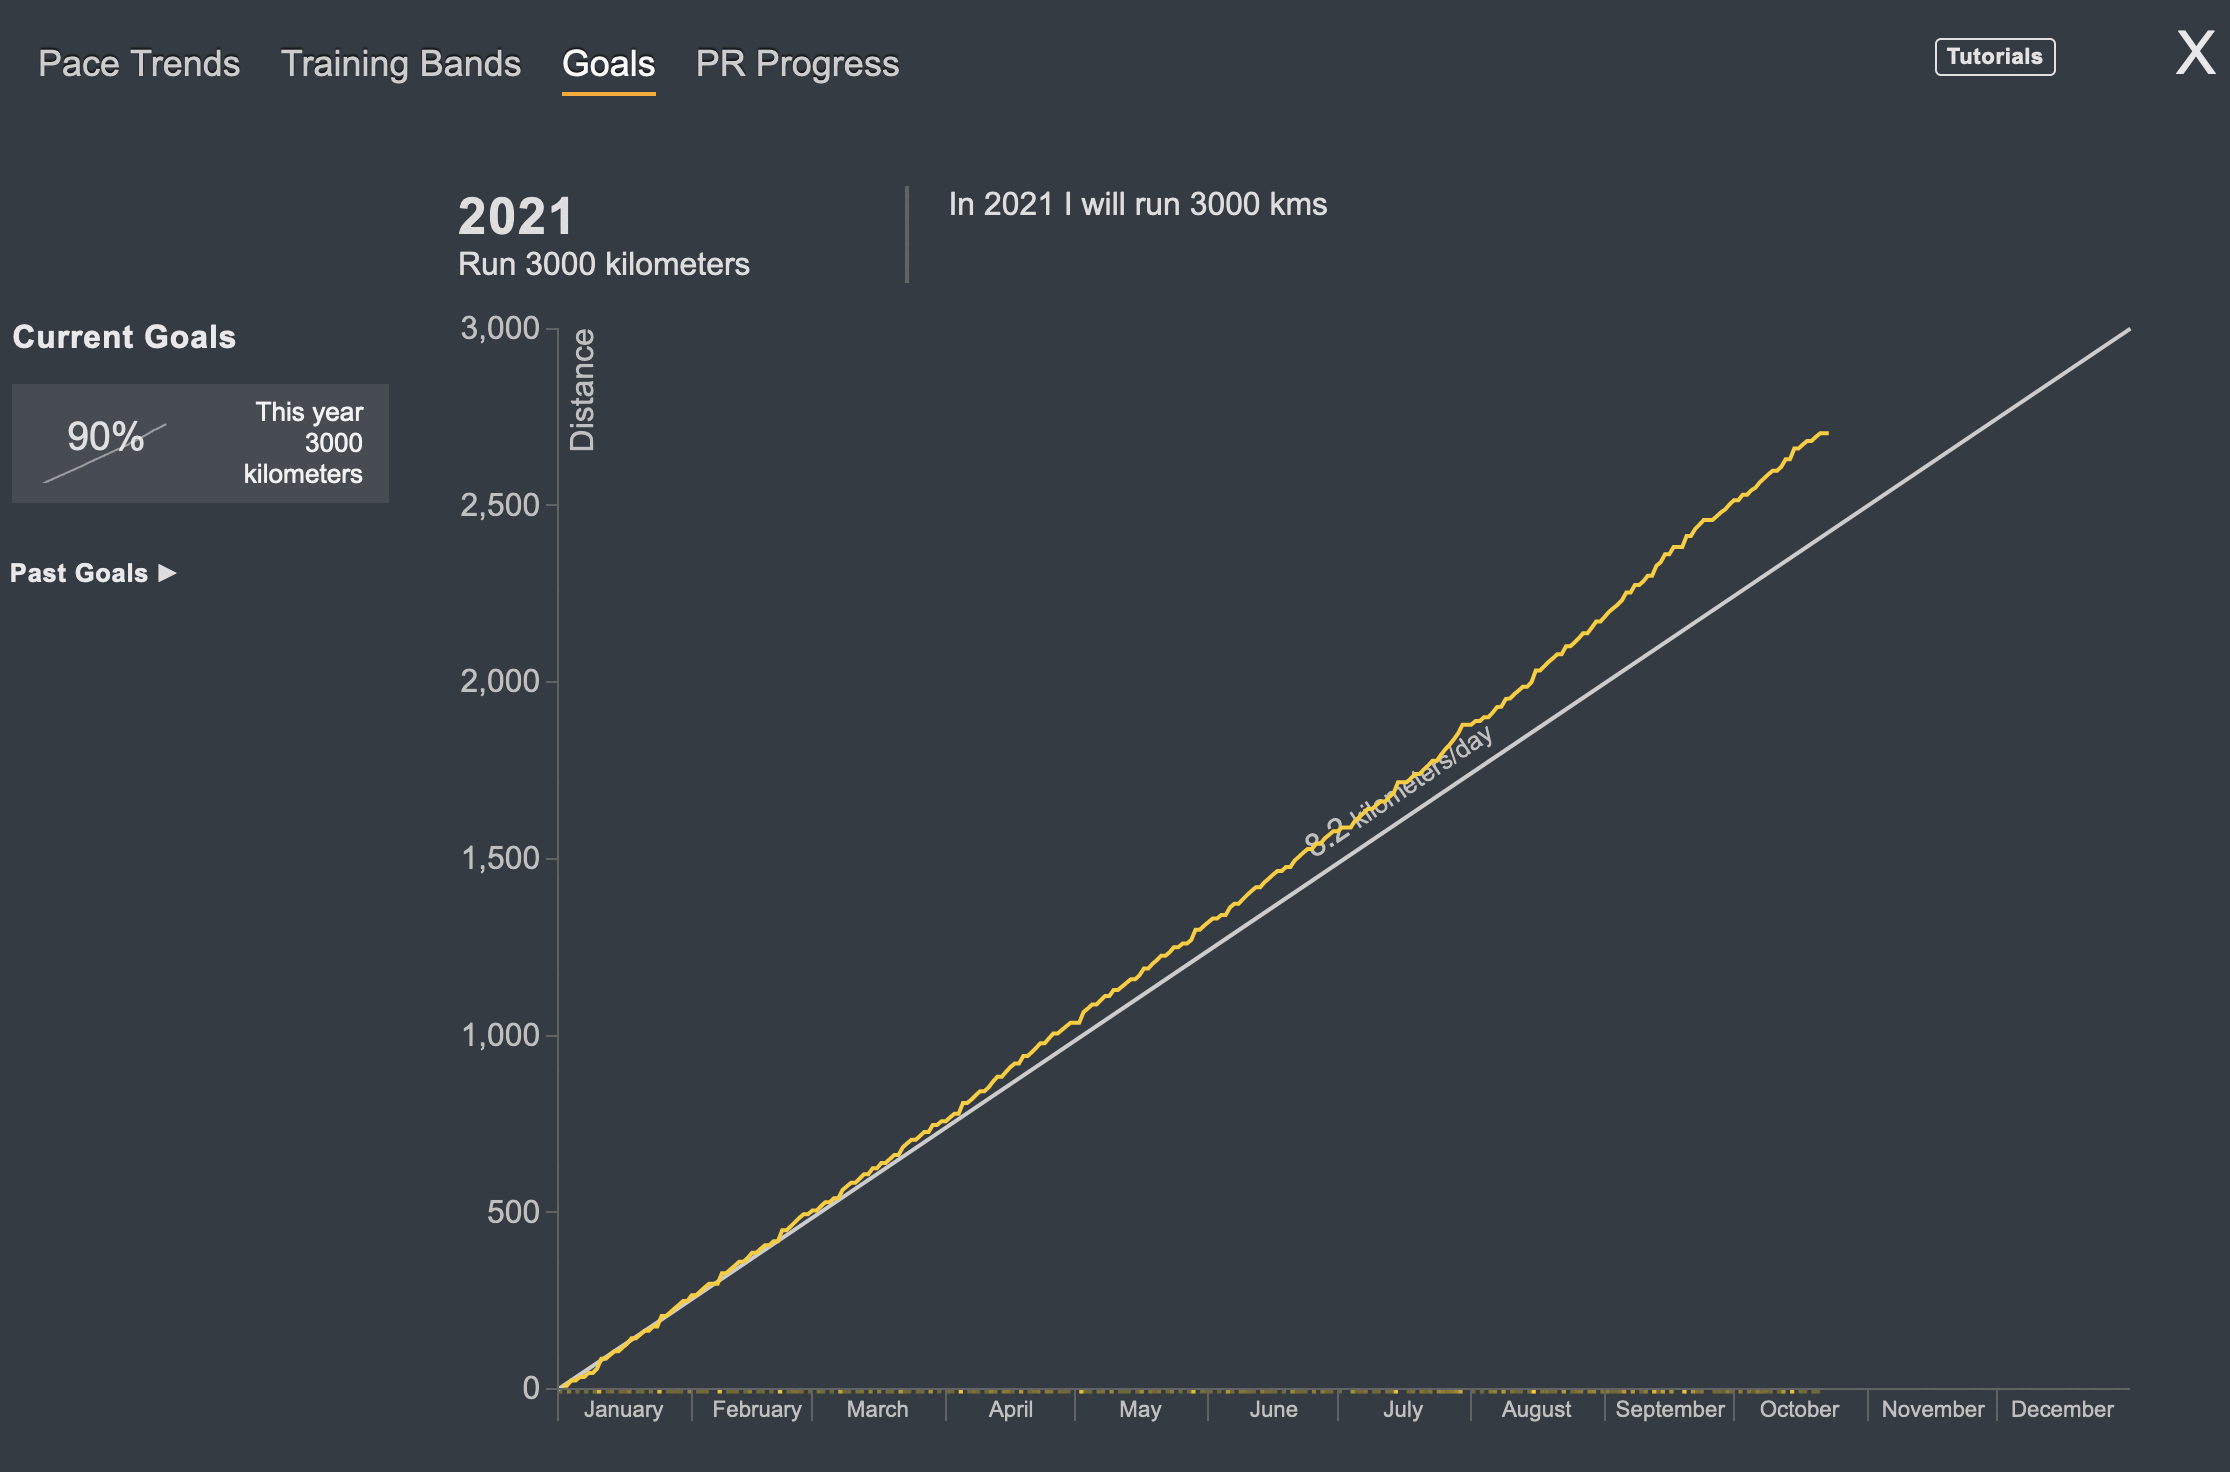
In that case, I followed the "desired trend" until April, and then I increased my load, so my progression moved accordingly.
Had I not followed this trend, this page would show me how many Kms per day I'd to run to catch up - which can be helpful to see how hard you need to go ;)
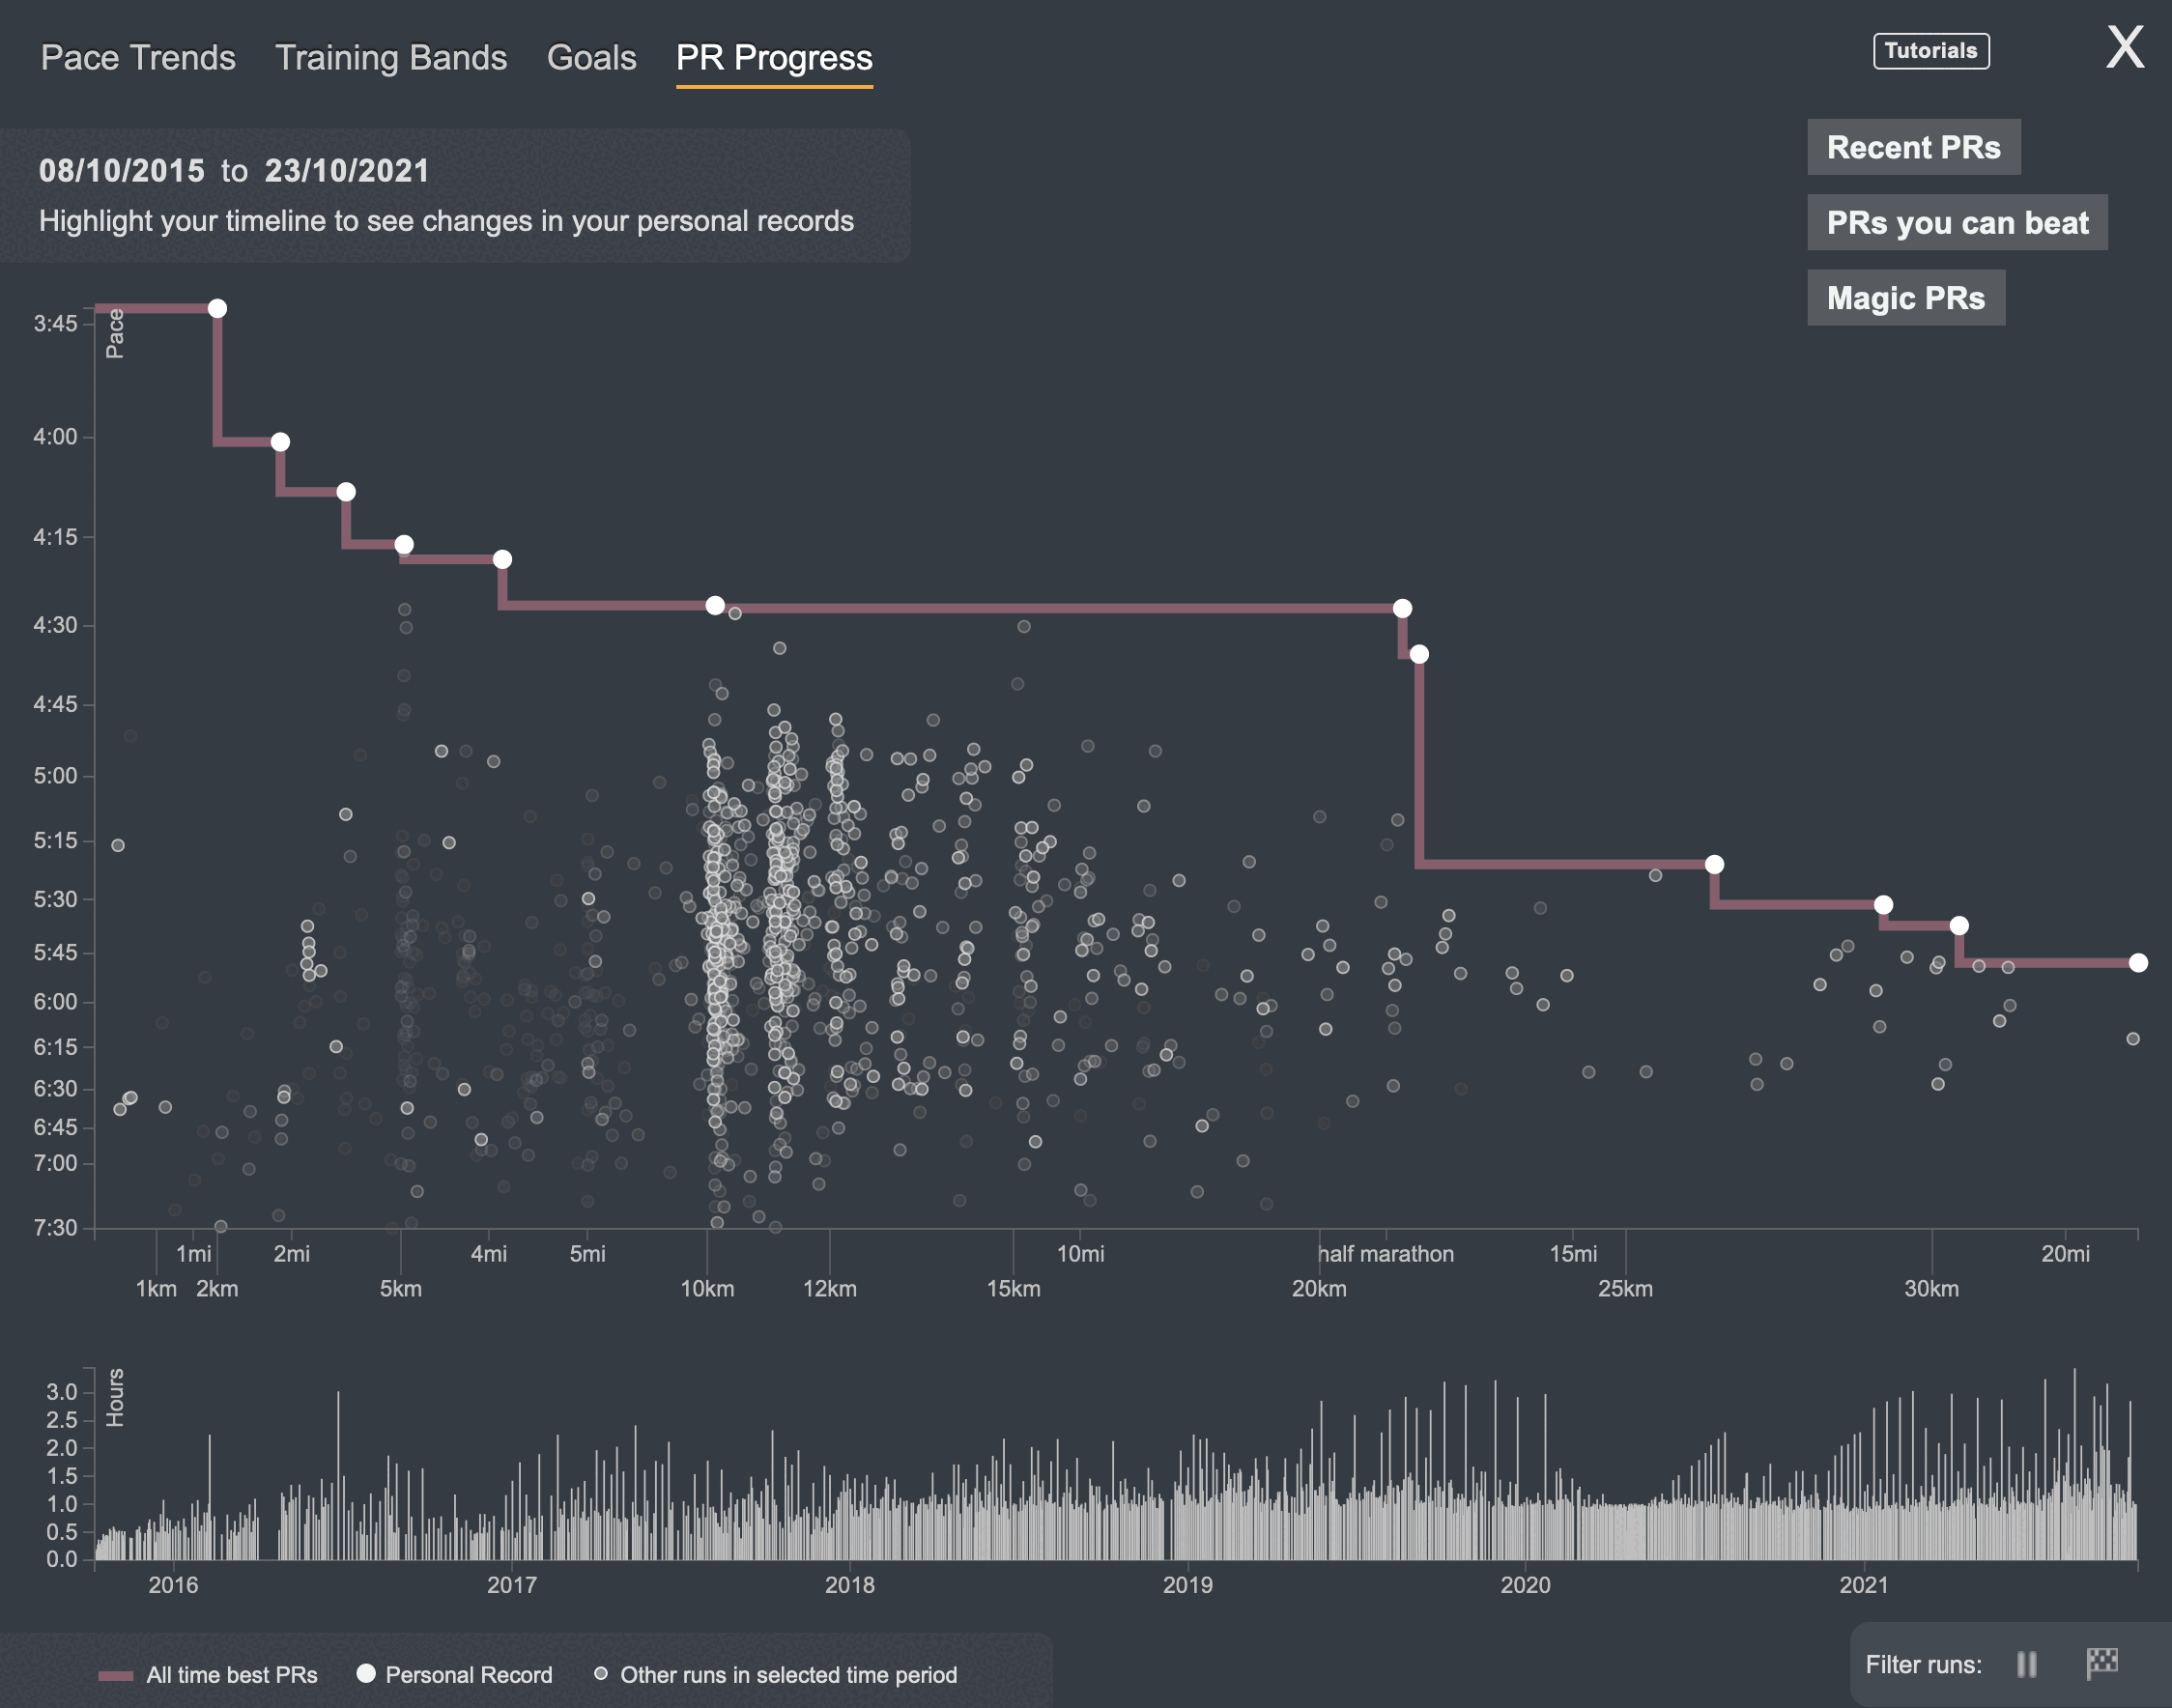
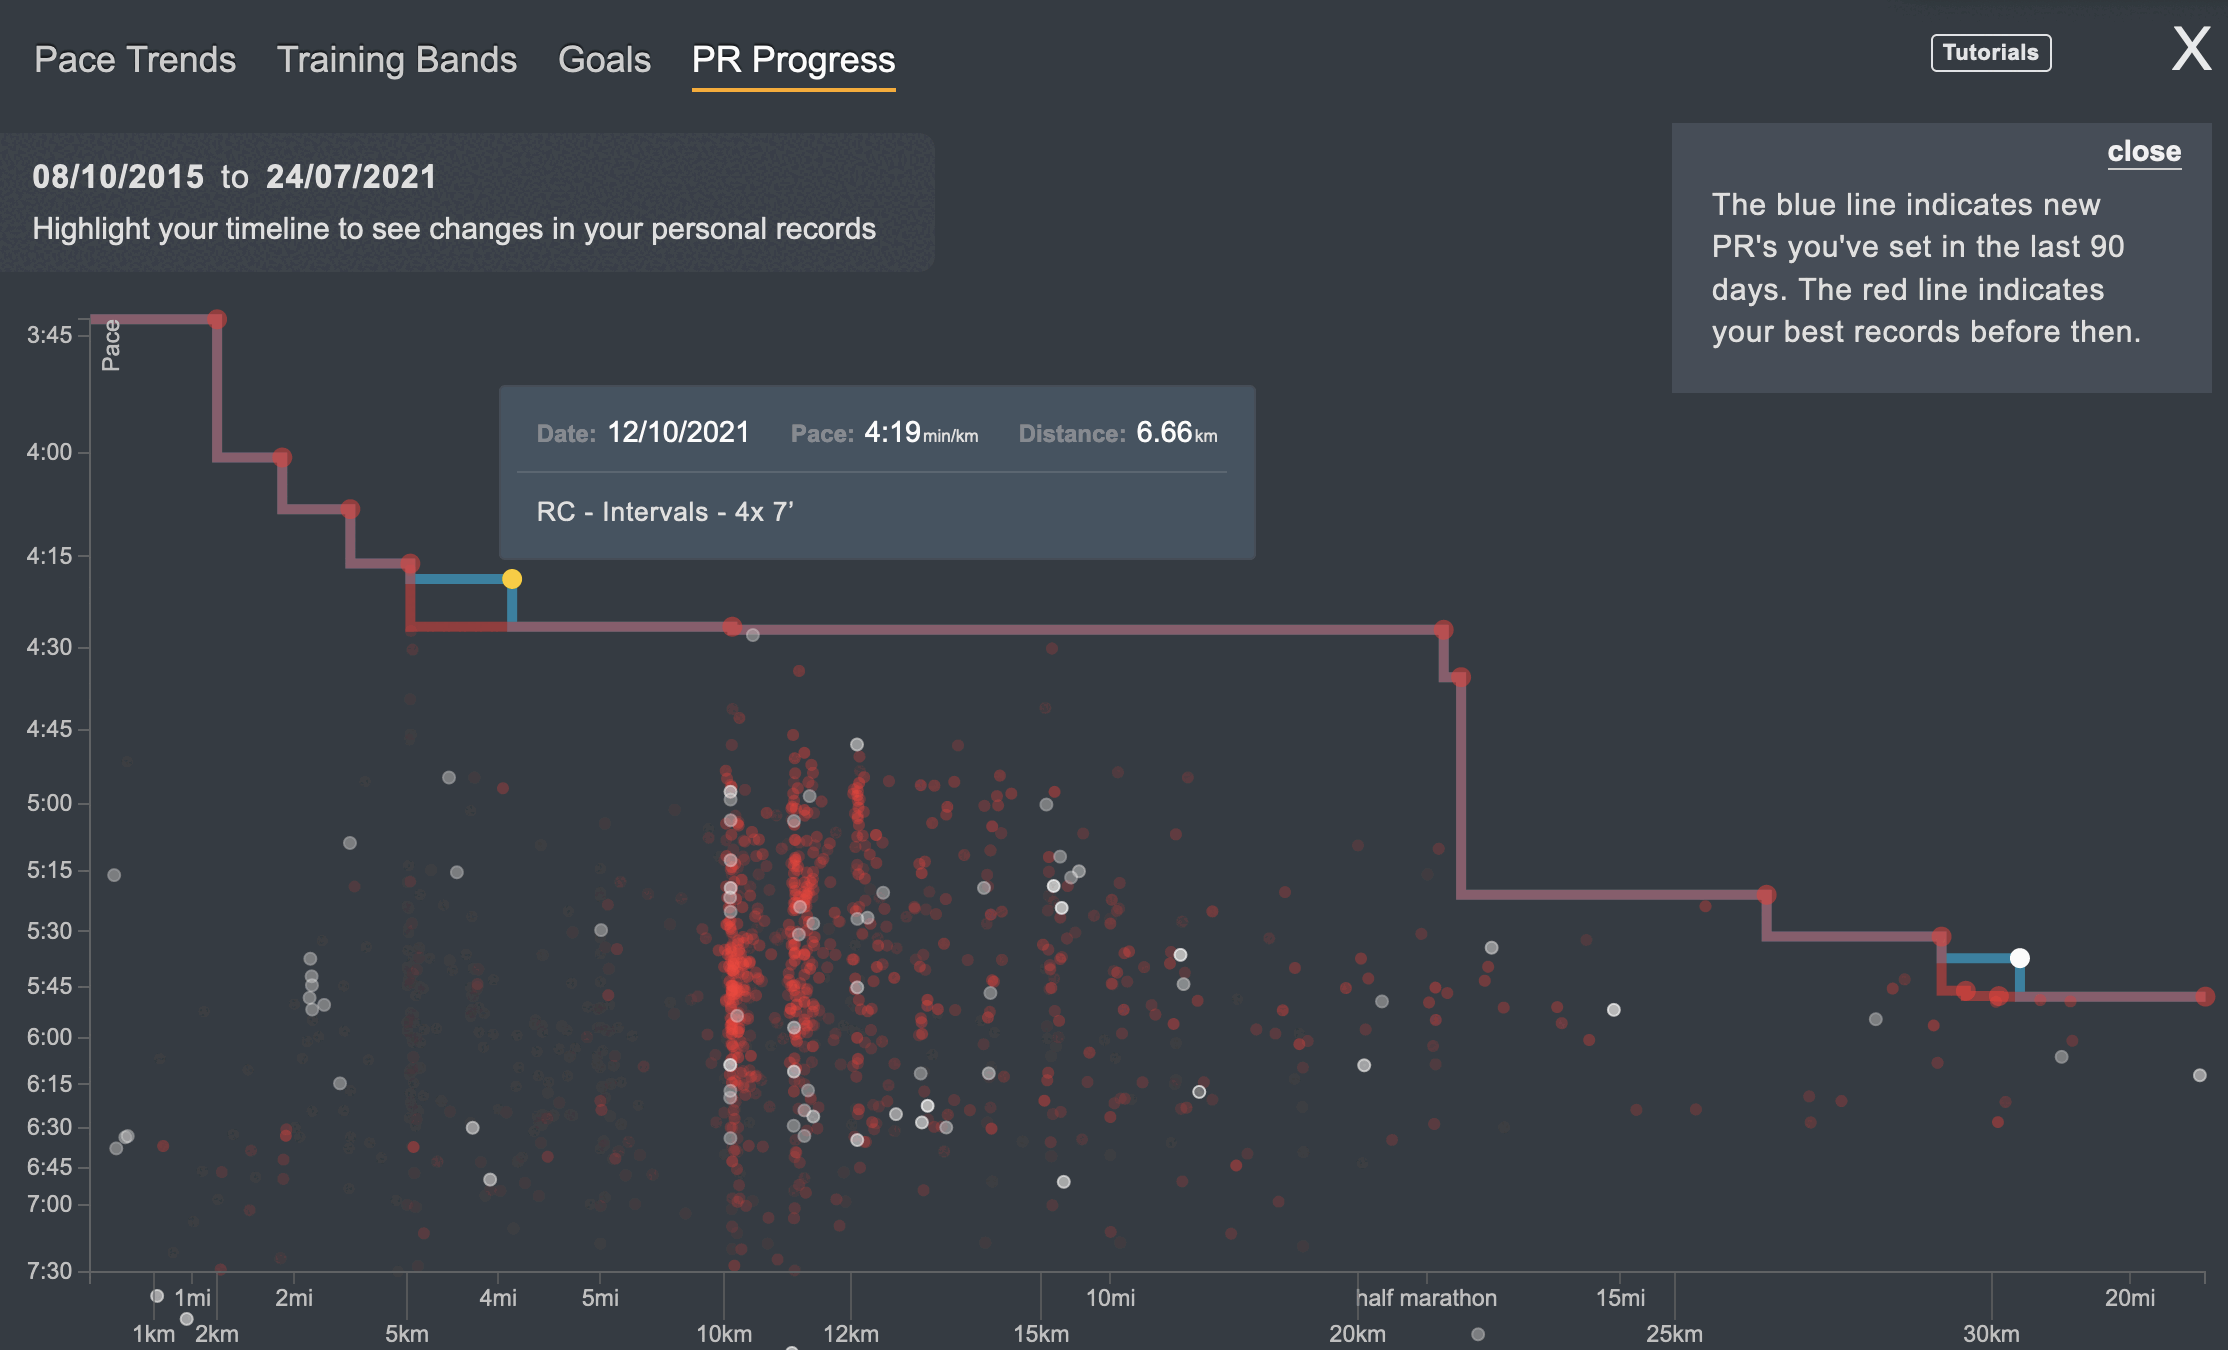
PR Progress allows seeing your PR (Personal Records), and see which ones you can beat:
"Social" network
There's also an embedded "social" part, where you can see your friends' run, and look for similar runners,
To be honest, I don't use that part much - for this I tend to use Strava - so I won't expand on that part.
Badges, you want badges?
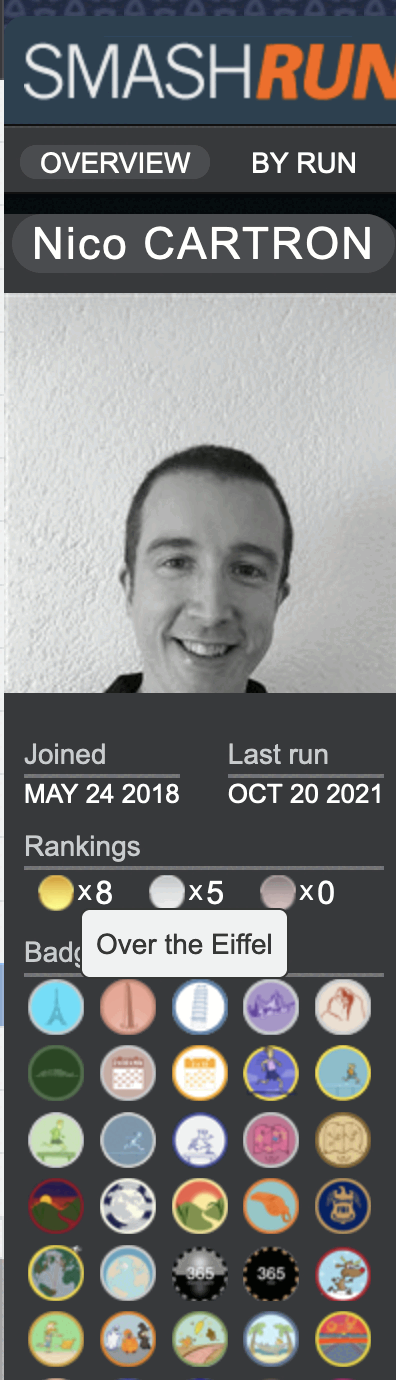
If you mouse over your name, a "sliding" popup will appear, revealing the badges that you've won:
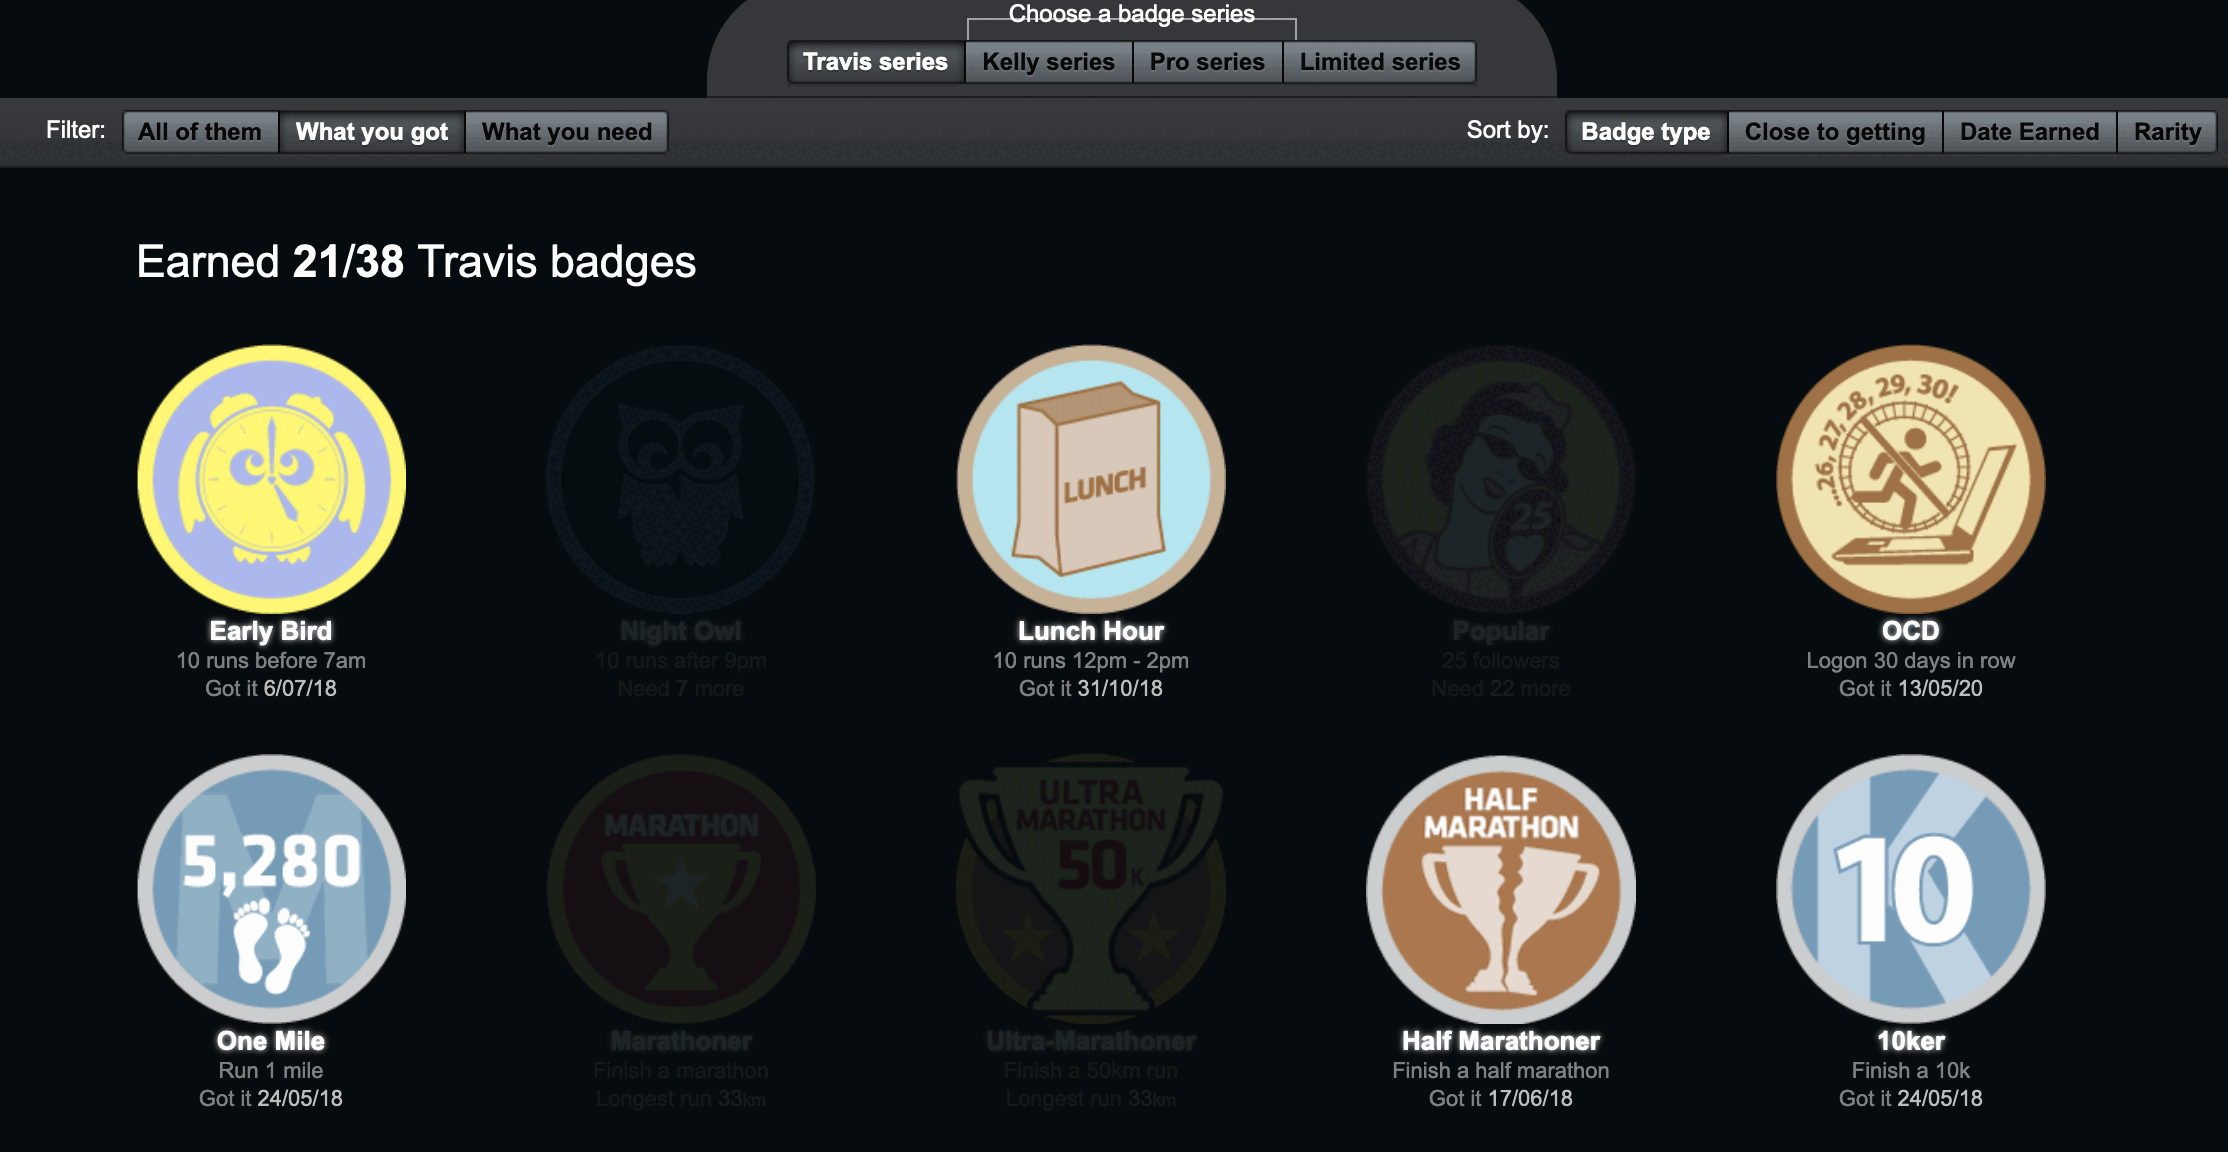
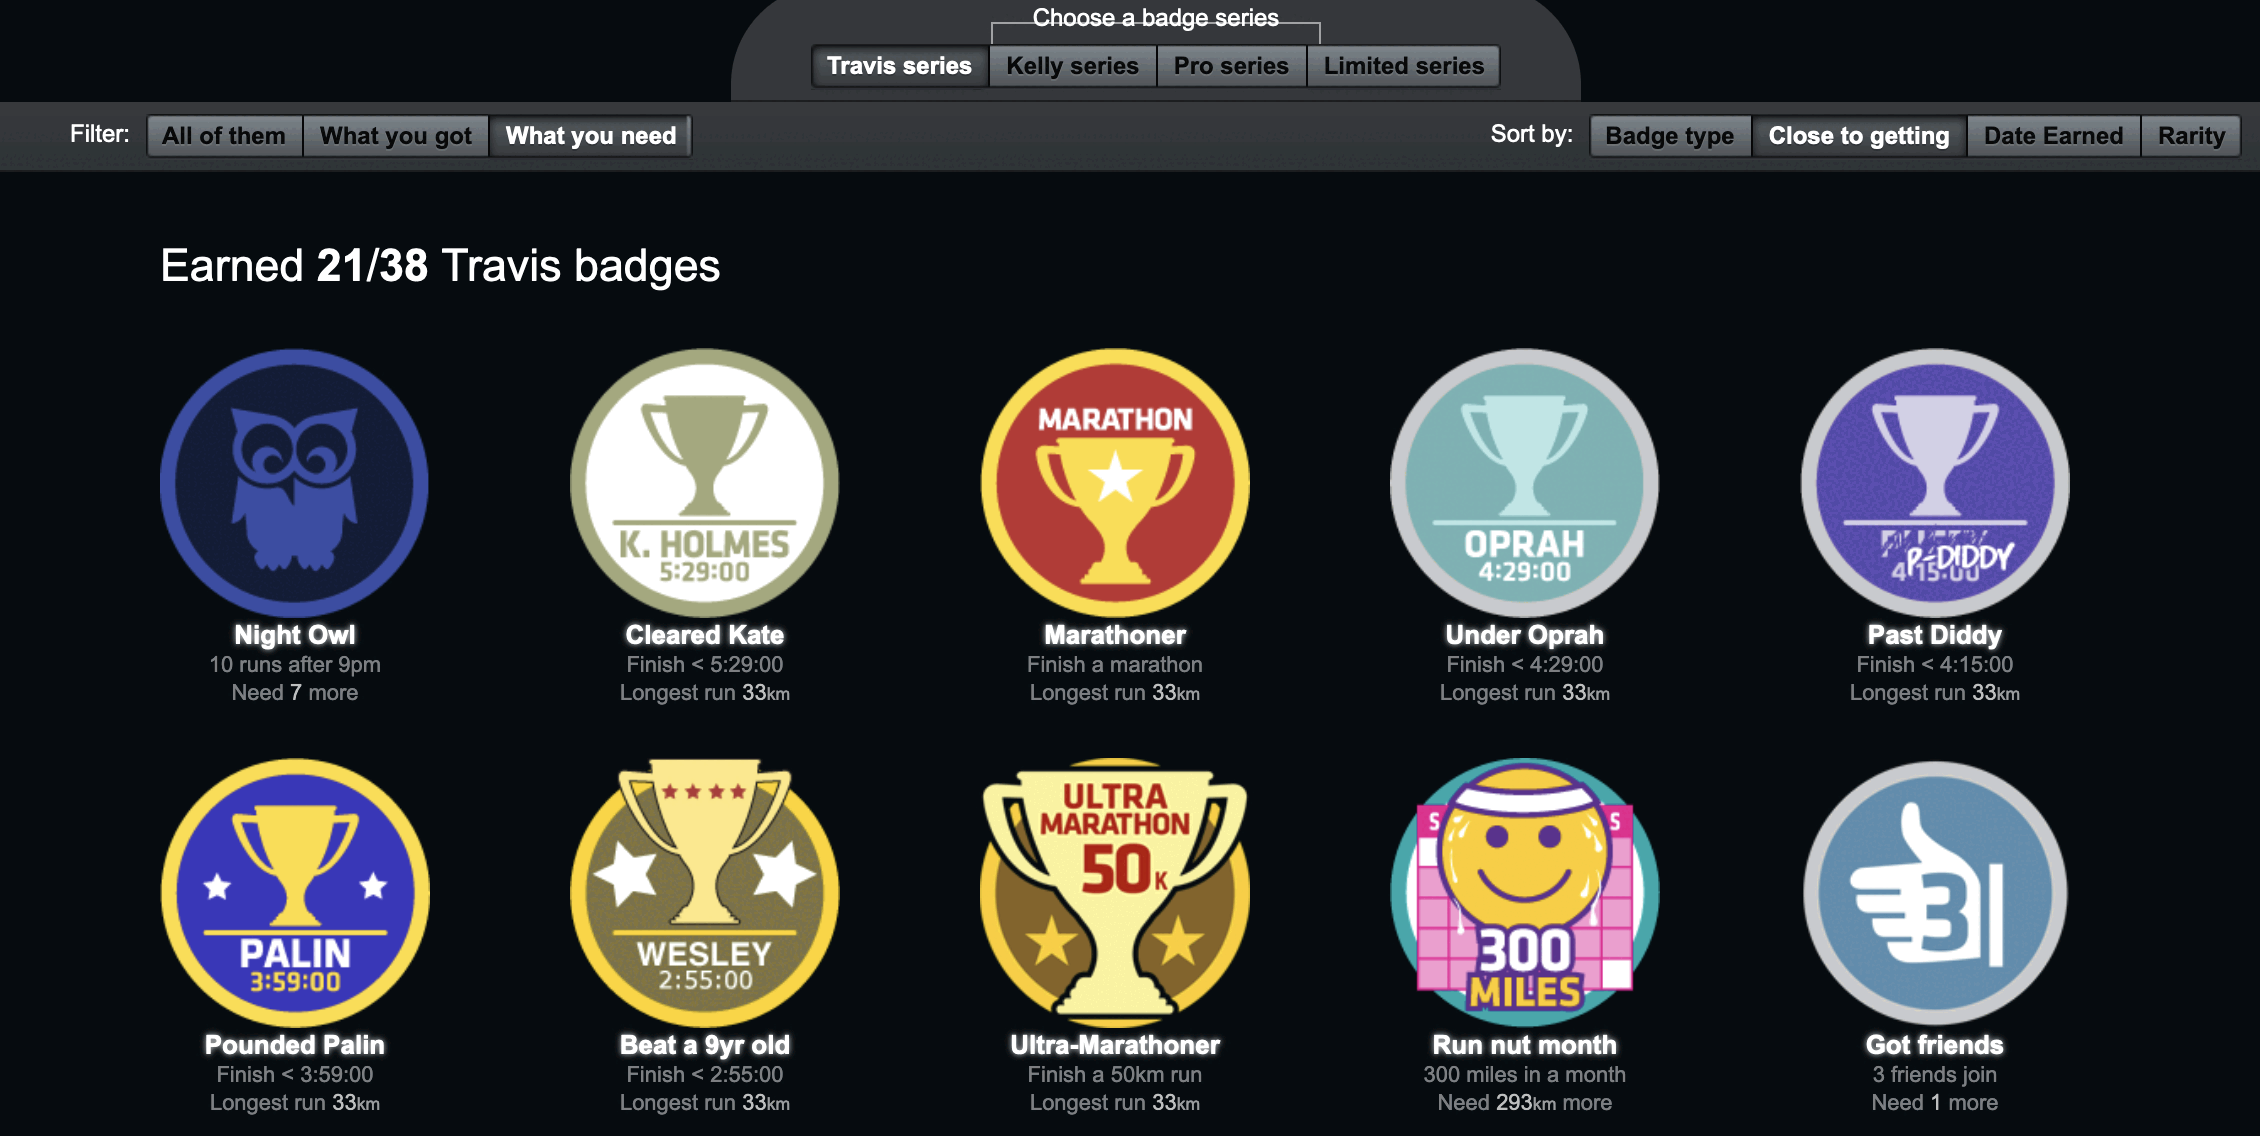
You can click on "Badges" in the top menu to display the badges you got:
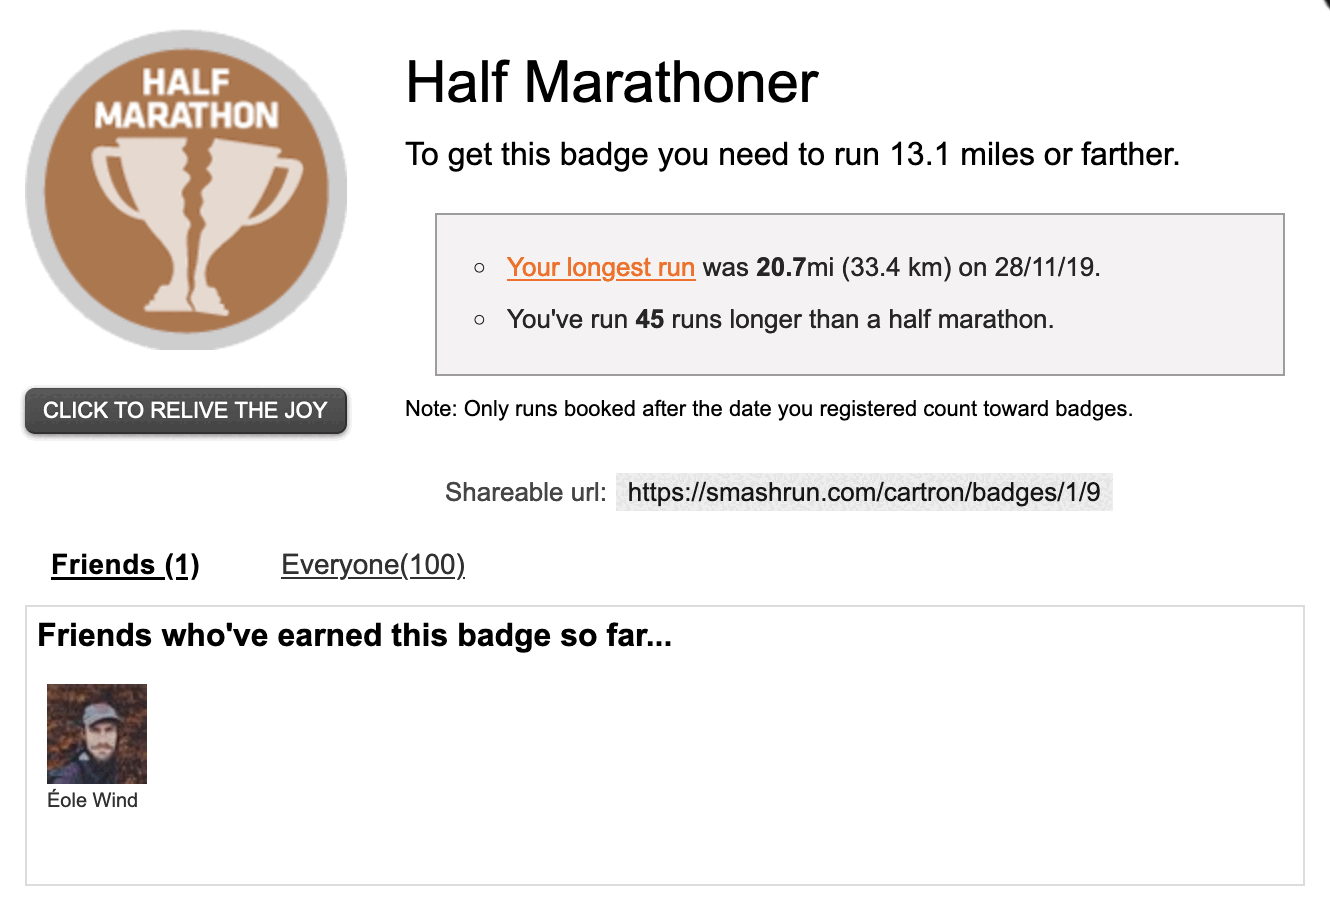
and clicking on one of them will give you more details related to this badge:
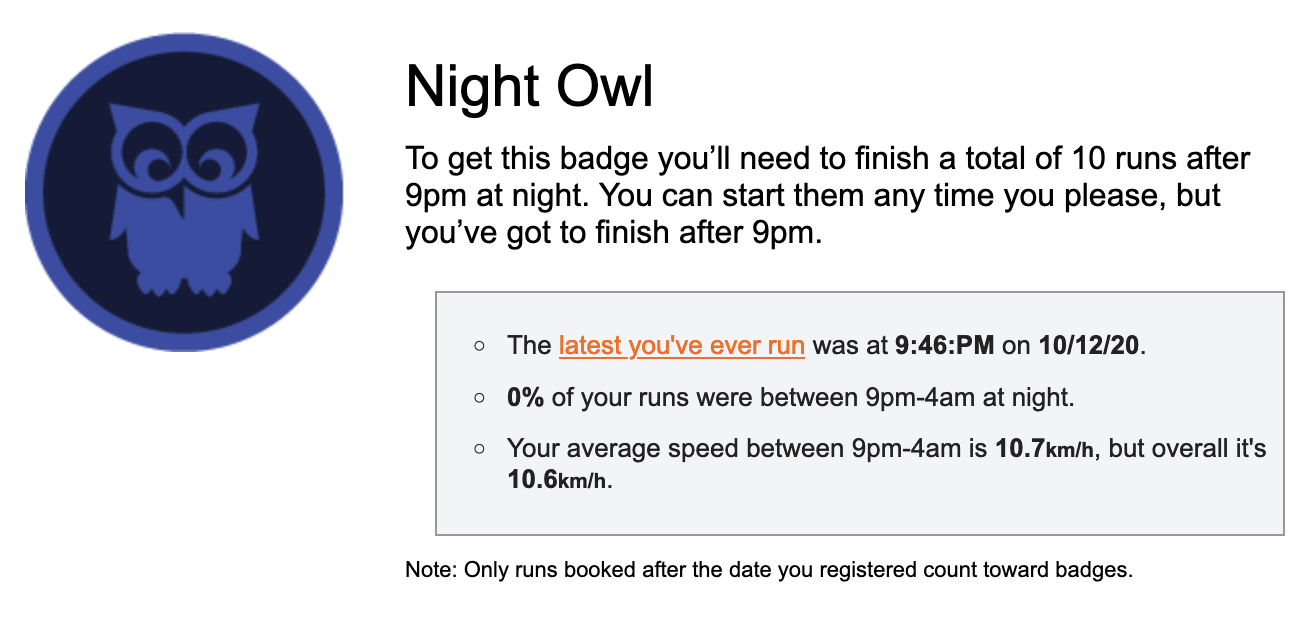
You can filter the badges to only display those you don't have yet, and clicking on e.g. the "Night Owl" will show me what it would take me to get it:
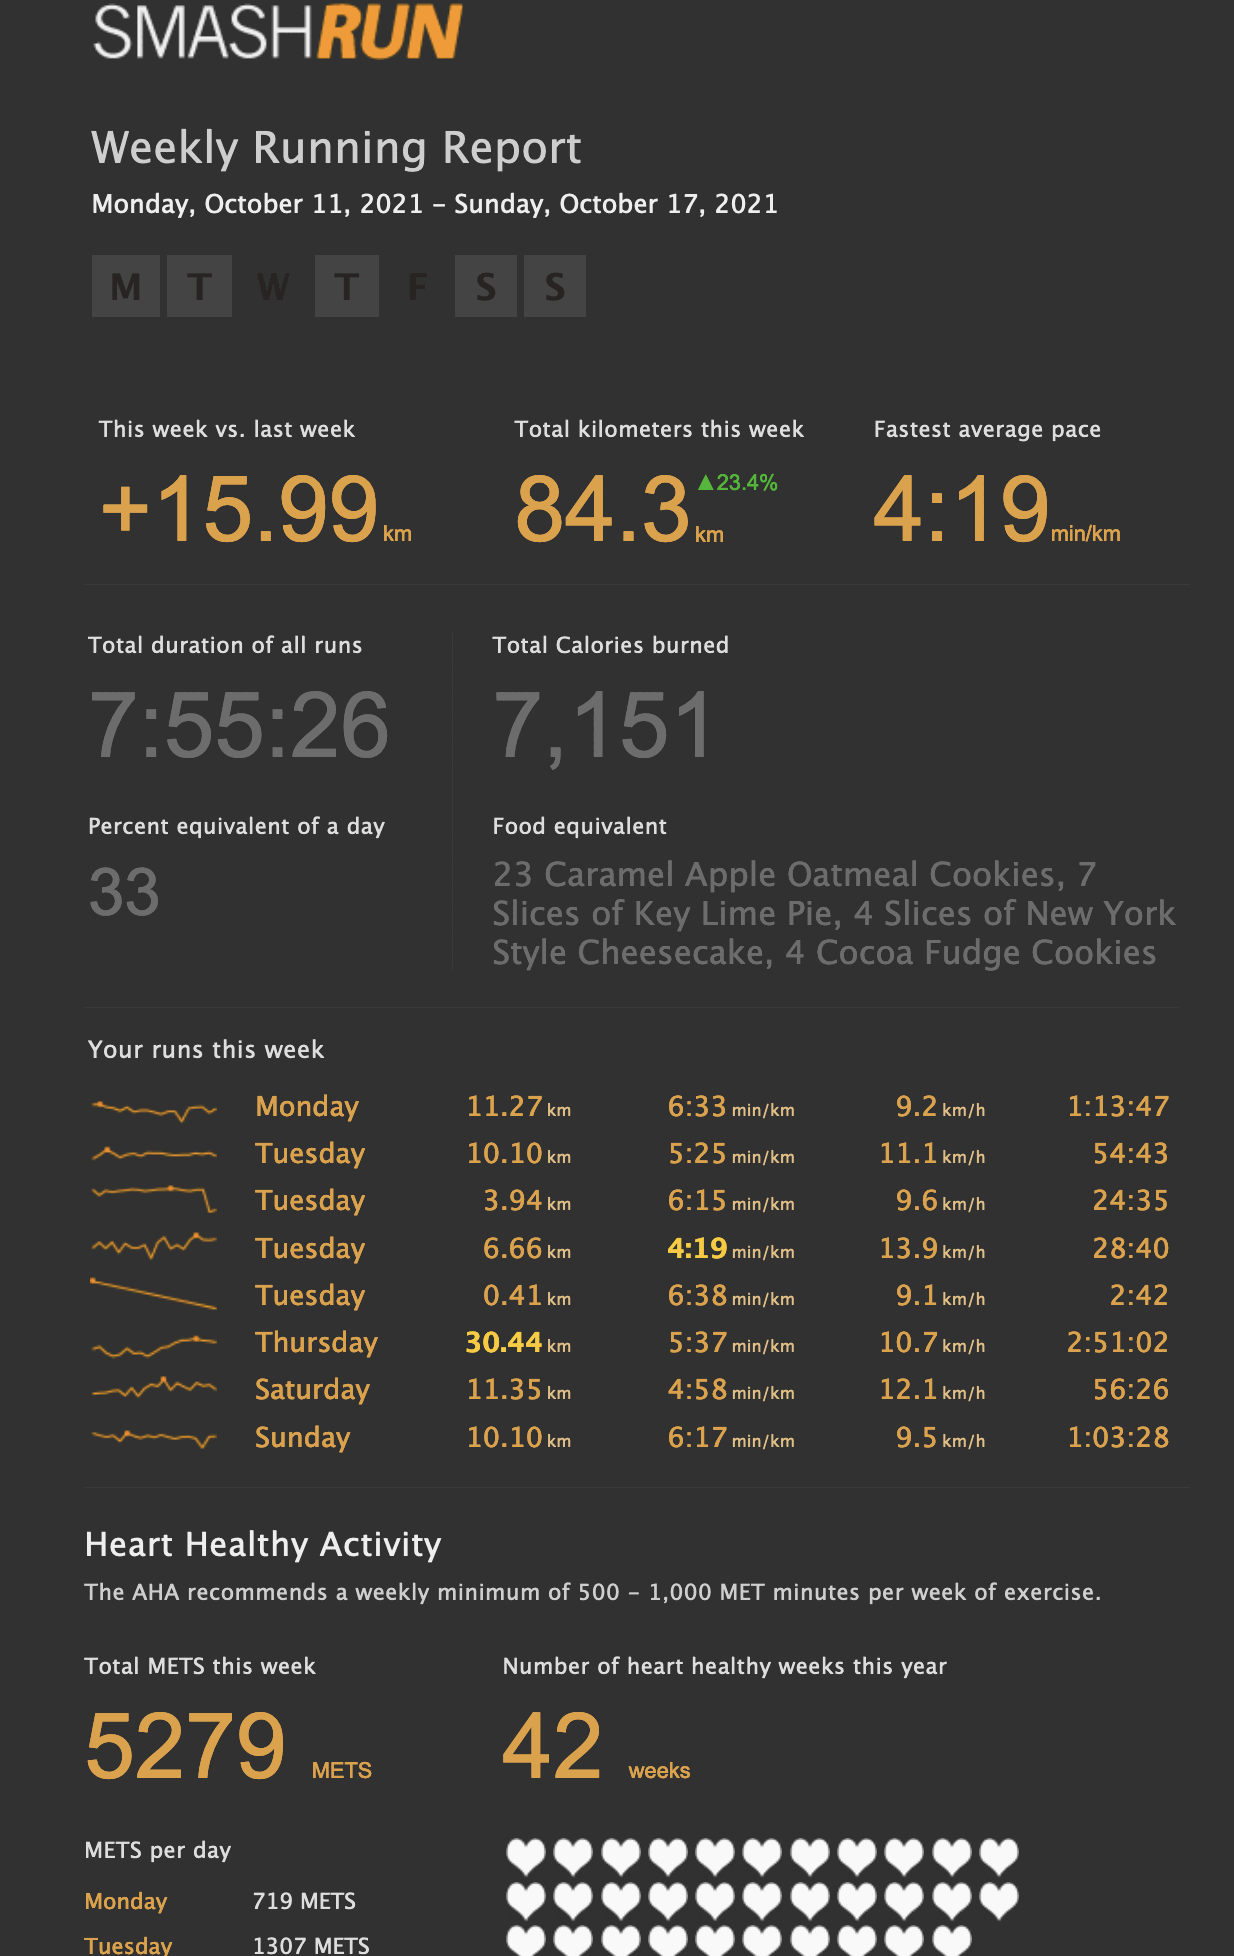
Cherry on the cake: the Monday email report
Every Monday, you will receive a summary by email about the previous week.
It's straight to the point, but also pretty fun as you'll get to know the "food
equivalent" of all the calories you burnt!
It's also nice to see how your week compares with the previous one, and on which days you had your longest or fastest run:
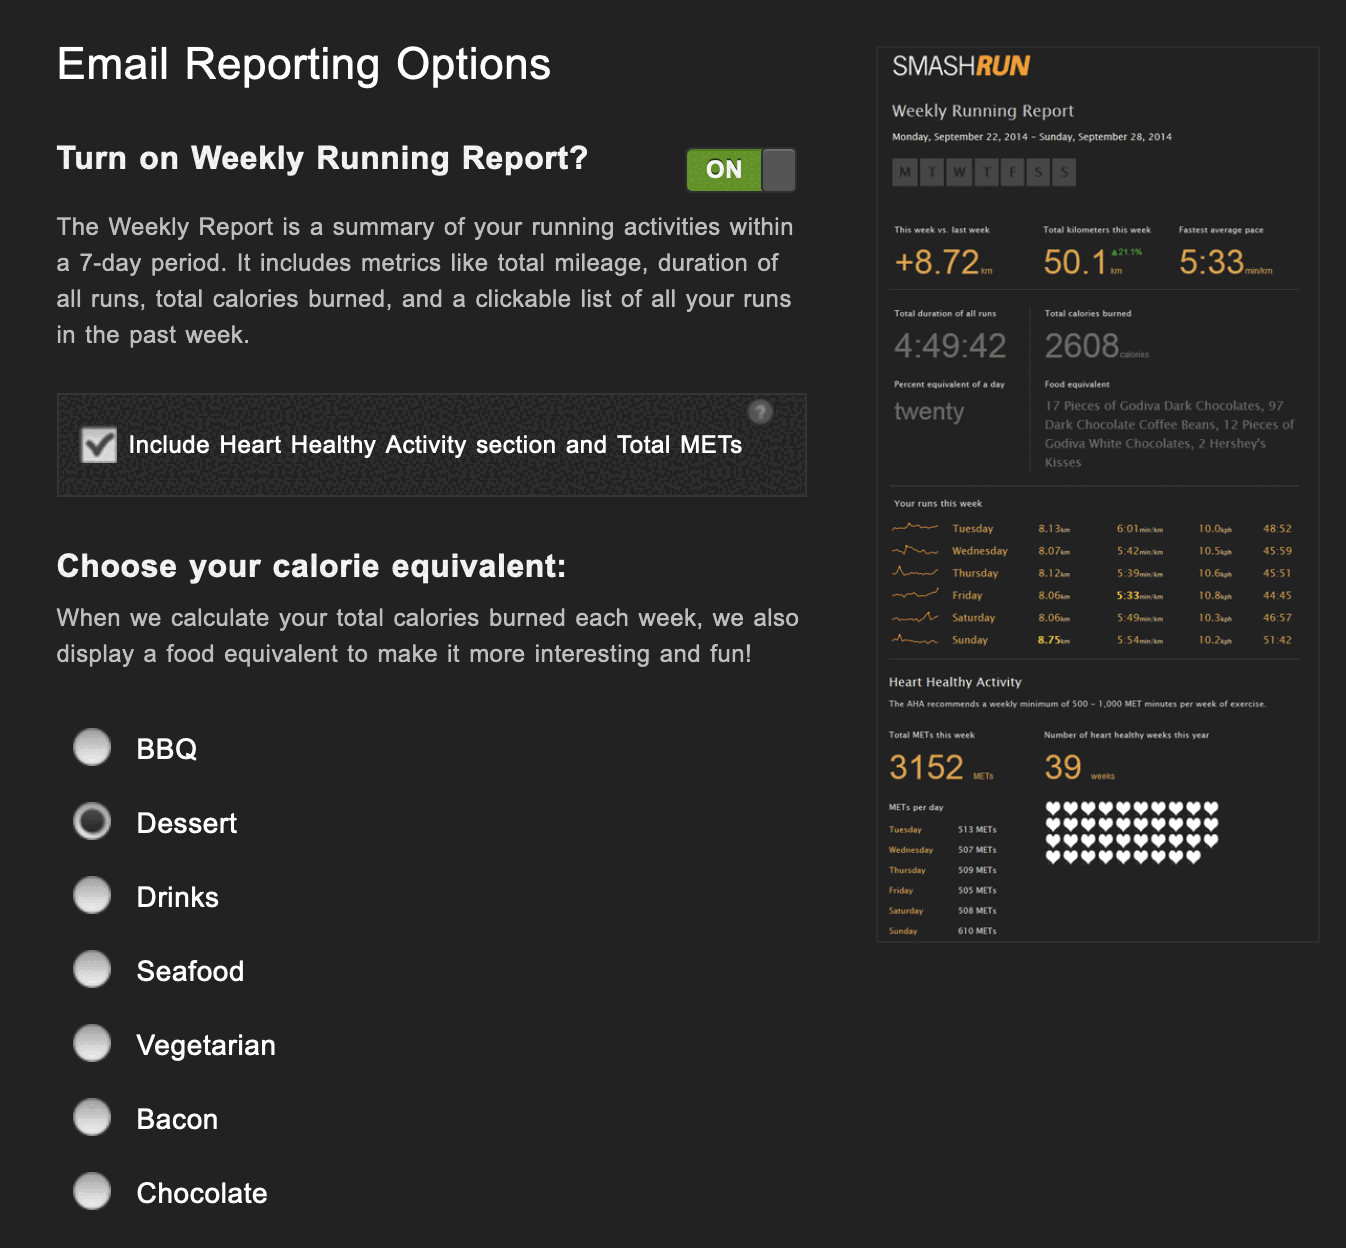
And you can even customize which kind of food you want to compare against, e.g. are you more into desserts, chocolate or BBQ? :-)
Wrap Up
This article is a bit longer than usual, but that's mainly because of all the
screenshots I have included.
And I haven't detailed all SmashRun features (e.g. list of all yours runs, how
to import a GPX or link to Suunto to import runs, ...)
Overall, I really like SmashRun (in case you didn't get it yet ;).
Disclaimer: I am not sponsored in any way by them, I'm just a casual runner
who likes getting detailed statistics, and in my opinion, SmashRun delivers just
that!
Tags: Running